Saturday, August 5, 2023

NASA Plans to Unleash a Wolf Pack of Rovers Onto the Lunar Surface in 2024

What’s better than one lunar rover? Three lunar rovers! In 2024, NASA plans to send a team of suitcase-sized wheeled robots to the Moon as part of the Commercial Lunar Payload Services (CLPS) program. Collectively called CADRE – Cooperative Autonomous Distributed Robotic Exploration – the rovers will spend one full lunar day (14 Earth days) exploring the Moon and showing off their unique capabilities.

The CADRE rovers are special – they are designed to be able to complete tasks without relying on humans to solve their problems. Mission control will send the rovers tasks, but it is the rovers’ job to figure out how best to carry them out while avoiding obstacles and conserving precious electricity.

“Our mission is to demonstrate that a network of mobile robots can cooperate to accomplish a task without human intervention – autonomously,” says Subha Comandur, the CADRE project manager at NASA’s Jet Propulsion Laboratory. “It could change how we do exploration in the future. The question for future missions will become: ‘How many rovers do we send, and what will they do together?’”

Some of the planned tests for CADRE include driving in formation while maintaining relative positions from each other, all while avoiding potentially dangerous or rough terrain. In another test, they will use stereo cameras to create a 3D topographical map of a 400 square meter area.

They will also test how the rovers would react upon losing one of the trio. Part of the use case for a swarm of rovers like this is that one rover could explore a dangerous but scientifically interesting area, like a lava tube, without endangering the entire mission. One rover could sacrifice itself for important but difficult-to-reach data, which it would beam back to its counterparts, and they would continue on their mission without it.

Engineer Kristopher Sherrill observes a development model rover during a test for NASA’s CADRE technology demonstration in JPL’s Mars Yard in June. Credit: NASA/JPL-Caltech.

That is a vision of the future, of course. CADRE is a technology demonstration mission and not, primarily, a mission of exploration. The pack of rovers will remain reasonably close to the lander which carries them to the surface, which will act as a home base and communications center.

But the Moon is a hazardous environment nonetheless, and they will be pushed to their limits keeping their power supply and cooling systems in working order. Part of CADRE’s testing campaign will involve ensuring the cooperative autonomy software on board each rover has enough power to run their processors. Each of the rovers, and the home base, carry a processor already being used in another example of robotic teamwork: the Ingenuity helicopter on Mars, which has been scouting ahead of the Perseverance rover in Jezero Crater.

The lunar environment offers different challenges than Mars does, with its especially high daytime temperatures. The rovers will work in half-hour stints, then ‘sleep’ to recharge, radiating away heat and keeping their processors in good shape. Upon waking, they can share their respective working conditions with each other, choosing a leader to assign the next tasks, and carrying on with the mission.

Assuming all goes well, the rovers are carrying scientific instruments too. In particular, they have ground penetrating radar that can peer as deep as 10 meters below the lunar surface. Working in tandem, they will be able to create a 3D map of the subsurface that a single rover wouldn’t be able to do on its own.

Ultimately, CADRE will be a short mission. After two weeks, lunar night will spell the end of the rovers’ capabilities. Their solar panels will be shadowed and their power supply cut off.

But those two weeks promise to be a flurry of activity and provide a wealth of engineering and scientific data that will shape the future of robotic exploration. Someday, roving packs of robots may support humans in their exploration of the solar system, taking risks for science that a single explorer – human or robot – wouldn’t dare attempt alone.

Learn More:

NASA’s Trio of Mini Rovers Will Team up to Explore the Moon. JPL.

The post NASA Plans to Unleash a Wolf Pack of Rovers Onto the Lunar Surface in 2024 appeared first on Universe Today.


JWST Sees Multiple Gravitational Lenses in a Massive Cluster: “The Fishhook” and “The Thin One”

We’ve been getting plenty of spectacular images from the James Webb Space Telescope since it began operations last year. Fraser even covered everything we learned from it in a video a few weeks ago. But the news keeps coming, and recently a science team known as the Prime Extra-Galactic Areas for Reionization and Lensing Science (PEARLS) team released a series of four papers describing Webb’s observations of a galaxy cluster known as El Gordo (“the fat one” in Spanish). But what’s more – they also released another absolutely stunning picture.

To fully understand the picture shown as the banner, but also provided in greater detail in the link below, it’s essential first to understand gravitational lensing. We’ve discussed the general concept many times before and even shown some fascinating images of objects known as Einstein rings. The critical thing to understand is that large objects, such as the El Gordo galaxy cluster formed about 6.8 billion years ago, can magnify objects appearing directly behind them by bending the light around their mass, creating an effect called “gravitational lensing.”

This is precisely why the Webb team turned their attention towards this massive galaxy cluster, which is thought to be the biggest that existed at that point in the universe’s life. Hubble, Webb’s predecessor as an amazing astronomical picture-taker, also took some images of El Gordo, but it wasn’t sensitive enough to capture the full grandeur of the scene. 

Video released along with the papers touring the El Gordo Cluster.
Credit – JWST YouTube Channel

A bonus of those fantastic images is astronomers can use them for science. One of the four papers from the PEARLS team, led by Brenda Fyre of the University of Arizona, discusses the overall effect of the gravitational lensing effect offered by El Gordo, but the other three look at specific features of the image.

First, we have one of the most noticeable features of the image – in the upper right, there appears to be a galaxy that is curved like a fishhook, which is what one of the graduate students on the PEARLS team nicknamed it. In Webb’s infrared image, it appears red, partially due to dust inside the galaxy itself but also due to the redshift caused by the light traveling 10.6 billion years to get to us.

The Fishhook is a relatively small disk galaxy that is only about ¼ the size of the Milky Way. It even appears to be dying out over 10 billion years ago, as the star-forming region in the center was rapidly declining, also known as “quenching” in astronomical jargon. That discovery was the subject of the second paper, led by Patrick Kamieneski of Arizona State University.

Fraser’s description of gravitational lensing

Another feature that some observers may even mistake as an imaging artifact is the line in the middle left of the image. That is, in fact, another galaxy being lensed by El Gordo that is even further away from Earth at 11 billion years. Known as La Flaca (“the thin one” in Spanish). While that galaxy itself is simply cool looking, a more subtle feature of the image intrigues scientists.

Near La Flaca, there is a red dwarf star that is the first of its kind to be observed beyond 1 billion years from Earth. Now named Quyllur, the Quechua word for star, it was only possible to see because of El Gordo’s gravitational lensing and Webb’s ultrasensitive sensors. Typically far away individual stars have to be “blue” so that the redshift caused by being so far away doesn’t move their light out of the observed spectra. But with Webb’s instruments, Quyllur will likely only be the first of many the telescope will find. Its discovery was discussed in the third paper, led by Jose Diego of the Instituto de Fisica de Cantabria in Spain.

There are other, less notable features of the image that also attract the interest of scientists. One is a miniature galaxy cluster formed 12.1 billion years ago, while another is a set of “ultra-diffuse” galaxies. The stars are spread far apart in these, making them difficult to image as a “galaxy” per se. But Webb was able to, at a here-to-fore unheard of distance of 7.2 billion light years. The farther-away diffuse galaxies even look different than the ones that are closer to home, as discussed in the fourth paper by Timothy Carleton, also of Arizona State.

Overall, this series of papers brings together a wealth of scientific knowledge with the inspiration of one of the most amazing astronomical photographs ever taken. And more will surely keep coming as Webb continues its operations into its second year.

Learn More:
Webb Space Telescope – Webb Spotlights Gravitational Arcs in ‘El Gordo’ Galaxy Cluster
B Fyre. et al. – The JWST PEARLS View of the El Gordo Galaxy Cluster and of the Structure It
Magnifies

Kamieneski et al. – Are JWST/NIRCam color gradients in the lensed z=2.3 dusty star-forming galaxy El Anzuelo due to central dust attenuation or inside-out galaxy growth?
J. M. Diego et al. – JWST’s PEARLS: A new lens model for ACT-CL J0102?4915, “El Gordo,” and the first red supergiant star at cosmological distances discovered by JWST
T. Carleton et al. – PEARLS: Low Stellar Density Galaxies in the El Gordo Cluster Observed with JWST
UT – What is Gravitational Lensing?
UT – This JWST Image Shows Gravitational Lensing at its Finest

Lead Image:
JWST image of the El Gordo galaxy cluster, and the galaxies that are gravitational lensed behind it.
Credit – NASA, ESA, CSA, Alyssa Pagan, Jake Summers, Jordan C. D’Silva, Anton M. Koekemoer, Aaron Robotham, Rogier Windhorst

The post JWST Sees Multiple Gravitational Lenses in a Massive Cluster: “The Fishhook” and “The Thin One” appeared first on Universe Today.


Friday, August 4, 2023

Follow a Simulated Journey of the Destruction of ESA’s Aeolus Mission

On July 28th, the European Space Agency commanded its long-working Aeolus wind profile mission to re-enter Earth’s atmosphere. It did that and disintegrated into pieces over Antarctica. Of course, satellites do this often. But, Aeolus was different. It maneuvered its way into a safe re-entry profile, a first-of-its kind activity designed to avoid populated regions on Earth.

To celebrate this accomplishment, ESA made a video showing a simulation of Aeolus’s re-entry. It was created using a model of the Aeolus spacecraft, considering its shape, size, mass and materials, and the effect of “aerothermodynamics”. That’s the study of how high-velocity gases behave, including thermal effects between gases and solid surfaces.

The tool used, SCARAB, creates a simulation of Aeolus’s reentry with ‘six degrees of freedom’, and shows the final moments of Aeolus’s reentry, when the spacecraft is falling naturally in an uncontrolled descent. This bird’s-eye view gave mission controllers a virtual view of their spacecraft making its final descent.

A simulation showing the last moments of ESA’s Aeolus spacecraft as it followed a guided trajectory into Earth’s atmosphere.

About The Mission

Aeolus was a valuable part of Earth observation satellite fleets launched by ESA and NASA, among others. The spacecraft’s mission may be over, but its data contributed a great deal to the science of weather forecasting. In particular, it became the first satellite to acquire high-quality global profiles of Earth’s wind. To do that, it used the only instrument it carried: a Doppler wind lidar that constantly measured winds up to an altitude of 30 km. It clocked velocities to an accuracy of 1 meter/second in the atmosphere up to 2 kilometers and to 2 meters per second in the troposphere up to 16 km. It could measure up to 100 wind profiles each hour.

The Doppler lidar (called ALADIN) made these measurements by firing ultraviolet light laser pulses into the atmosphere. Once in the wind streams, the light reflected off of gas molecules and dust. Some of the light scattered back to Earth, where a ground-based telescope collected it. By measuring the Doppler shift in those returned signals, scientists could figure out the horizontal speed of the winds at in the lowest 30 km of the atmosphere. This was a first-ever attempt to make these measurements, and Aeolus was able to do it successfully. Climate and weather forecasting models are now using the data it collected. It also contributed data for volcanic ash forecasts during eruptions—something extremely useful in aviation.

Guiding Aeolus Back to Earth

The spacecraft launched in 2018 and exceeded its three-year mission lifetime by two years. It was about to run out of fuel, leaving it to suffer an unguided re-entry. Plus, it had already dipped to a point where it was “seeing” the top of Earth’s atmosphere. Part of this was due to solar activity “puffing up” the atmosphere. So, mission planners decided to plot a guided final trip to Earth for Aeolus while they still had fuel to manoeuver the spacecraft.

Engineers worked out a set of moves that allowed the spacecraft to fall naturally to about 280 km. Then, the spacecraft got steered to about 150 km above Earth’s surface. At that point, the engineering team sent a final set of commands for the spacecraft to continue its path over unpopulated regions. At about 80 km, friction with the atmosphere mostly vaporized Aeolus disintegrating over Antartica. The U.S. Space Command confirmed the mission had ended, with the first assisted re-entry of any spacecraft.

Aeolus’s legacy will continue with future wind-profile lidars aboard other spacecraft. Future satellite-based lidar missions will be useful for long-term studies of Earth winds. But, they also have other uses. For example, they could be used to calibrate energy scales used by different cosmic-ray observatories. Such instruments will also help advance the technologies used to create space-borne lasers used in lidars.

For More Information

Simulating Aeolus’s Demise: a Bird’s-Eye View
Aeolus: ESA’s Wind Mission
Aeolus Re-entry: How We Made History

The post Follow a Simulated Journey of the Destruction of ESA’s Aeolus Mission appeared first on Universe Today.


A Massive Solar Storm was Detected on Earth, Mars, and the Moon

A coronal mass ejection erupted from the Sun on October 28th, 2021, spreading solar energetic particles (SEPs) across a volume of space measuring more than 250 million km (155.34 million mi) wide. This means that the event was felt on Earth, Mars, and the Moon, which was on the opposite side of the Sun at the time. It was also the first time that a solar event was measured simultaneously by robotic probes on Earth, Mars, and the Moon, which included ESA’s ExoMars Trace Gas Orbiter (TGO) and Eu:CROPIS orbiter, NASA’s Curiosity rover and Lunar Reconnaissance Orbiter (LRO), and China’s Chang’e-4 lander.

The ESA’s Solar Orbiter, Solar and Heliospheric Observatory (SOHO), and BepiColombo missions were also caught by the outburst and provided additional measurements of this solar event. The study of Solar Particle Events (SPE) – aka. solar flares – and “space weather” phenomena are vital to missions operating in Low Earth Orbit (LEO) – for example, crews living and working on the International Space Station (ISS). But it is especially vital for missions destined for locations beyond LEO and cislunar space, including Project Artemis and the many proposals for sending astronauts to the Moon and Mars in the coming years.

The event was described in a paper, “The First Ground Level Enhancement Seen on Three Planetary Surfaces: Earth, Moon, and Mars,” that recently appeared in the Geophysical Research Letters. The international team behind it consisted of scientists from the Deep Space Exploration Laboratory (DSEL), the CAS Center for Excellence in Comparative Planetology (CECP), the Institute of Experimental and Applied Physics (IEAP), the German Aerospace Center (DLR), the Space Research and Technology Institute (SRTI-BAS), the Southwest Research Institute (SwRI), the Leidos Corporation, and the Institute for the Study of Earth, Oceans, and Space (UNH-EOS).

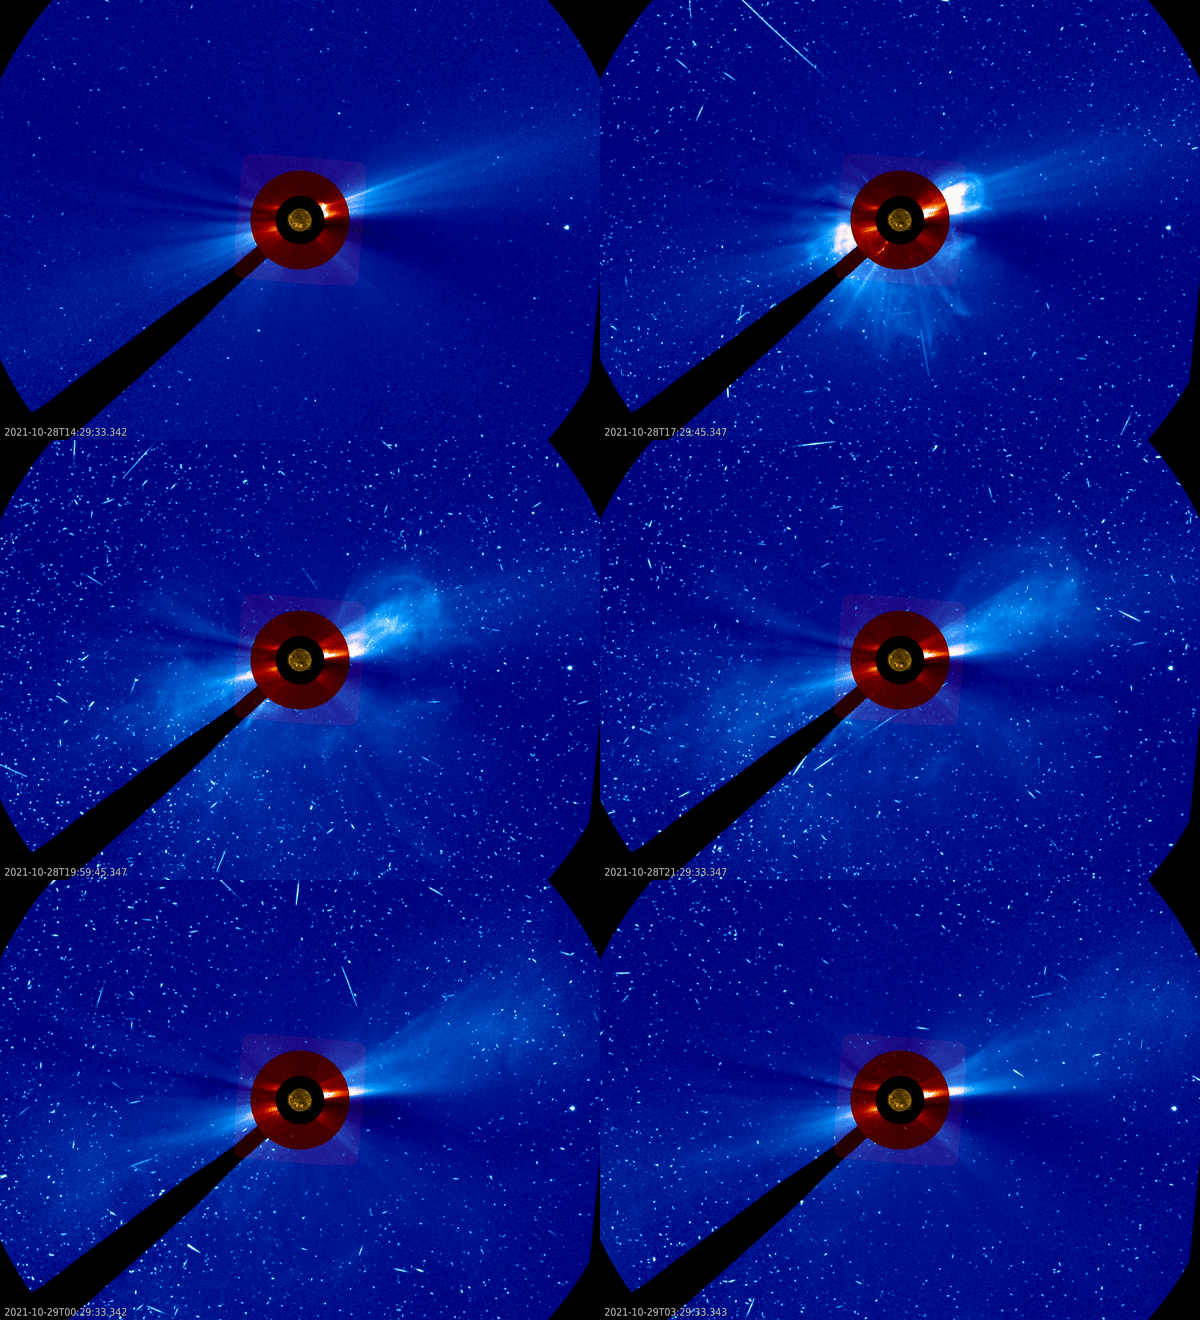
A coronal mass ejection, as seen by the ESA/NASA SOHO mission on October 28th, 2021. Credit: ESA/NASA

The 2021 solar event was an example of what scientists describe as a “ground level enhancement,” a rare occurrence where solar particles are energetic enough to pass through the Earth’s magnetic field and reach the surface. Only seventy-three ground-level enhancements have been detected since scientists began recording them in the 1940s, and no such events have been detected since. While Mars’ thin atmosphere does filter out the lower energy particles (and slows down the highly energetic ones), neither the Moon nor Mars generates similar magnetic fields.

This means solar particles reach the surface regularly and even produce secondary radiation (through interaction with surface regolith). According to measurements made by NASA’s LRO mission from lunar orbit, the solar event was rather weak, equivalent to an absorbed radiation dose of only 31 milligray (mGy) or 31 millisieverts (mSV). Meanwhile, the Exomars TGO and Curiosity rover, obtaining measurements from orbit and the surface, recorded doses of 9 and 0.3 three mGy (respectively) – a difference of a factor of 30.

Compare this to the solar outburst recorded in August 1972, which fell between the Apollo 16 and 17 missions. The measured outburst of radiation from this event would have delivered a fatal dose to any astronauts operating on the lunar surface. Jingnan Guo, a researcher with the DSEL with the School of Earth and Space Sciences at the University of Science and Technology of China (USTC), explained in an ESA press release:

“Our calculations of the past ground-level enhancement events show that, on average, one event every 5.5 years may have exceeded the safe dose level on the Moon if no radiation protection had been provided. Understanding these events is crucial for future crewed missions to the surface of the Moon.”

Astronauts are exposed to radiation regularly when they go to space, but the hazard of prolonged exposure increases dramatically beyond Low Earth Orbit (LEO). This includes the risk of exposure to solar radiation and cosmic rays, which becomes elevated beyond Earth’s magnetic field. But there is also the risk of huge outbursts of SEPs caused by “coronal mass ejections” (CMEs), also known as “solar flares.”

Artist’s impression of the Lunar Gateway with the Orion spacecraft docked on the left side. Credit: ESA

Impact on Astronaut Health

Given how much of our future planned exploration efforts are centered on the Moon and Mars, it is crucial to understand intense radiation events and their effect on the space radiation environment. According to ESA health guidelines, if astronauts absorb more than 700 milligray (mGy) of radiation during a mission – equivalent to 700 millisieverts (mSv) – they may experience radiation sickness caused by the destruction of bone marrow and damage to their central nervous system. This can lead to serious health problems, including nausea, infection, internal bleeding, and elevated cancer risks.

If an astronaut absorbed as much as 10 gray (10,000 sieverts), they would likely die within two weeks. This is why the ESA, NASA, and other space agencies are dedicated to limiting astronaut exposure to 1,000 mSv, or 3% Risk of Exposure-Induced Death (REID), during the entirety of their career. While radiation shielding is important, dedicated instruments that measure the radiation environment in space are used to predict major events. The advanced warning allows astronauts to seek protection within shielded environments, protective suits, and (in the future) lunar or Martian caves.

On the ISS, astronauts and cosmonauts will retreat to designated areas where the wall shield against incoming energetic particles. This includes the sleeping quarters (located in the Russian Zvezda and NASA Harmony modules) or one of the ISS’ galleys in the Nauka and Unity modules. For astronauts bound for the Moon, the Lunar Gateway will serve as the stopover point and a potential fallback position in the event of solar activity. The Gateway will rely on three instrument suites to monitor the radiation environment around the Moon and inside the Gateway. This includes the:

“Currently, we live in a golden age of Solar System physics,” said Marco Pinto, an ESA research fellow working on radiation detectors. “Radiation detectors aboard planetary missions such as BepiColombo, on its way to Mercury, and Juice, cruising to Jupiter, add a much-needed coverage to study the acceleration and propagation of solar energetic particles,”

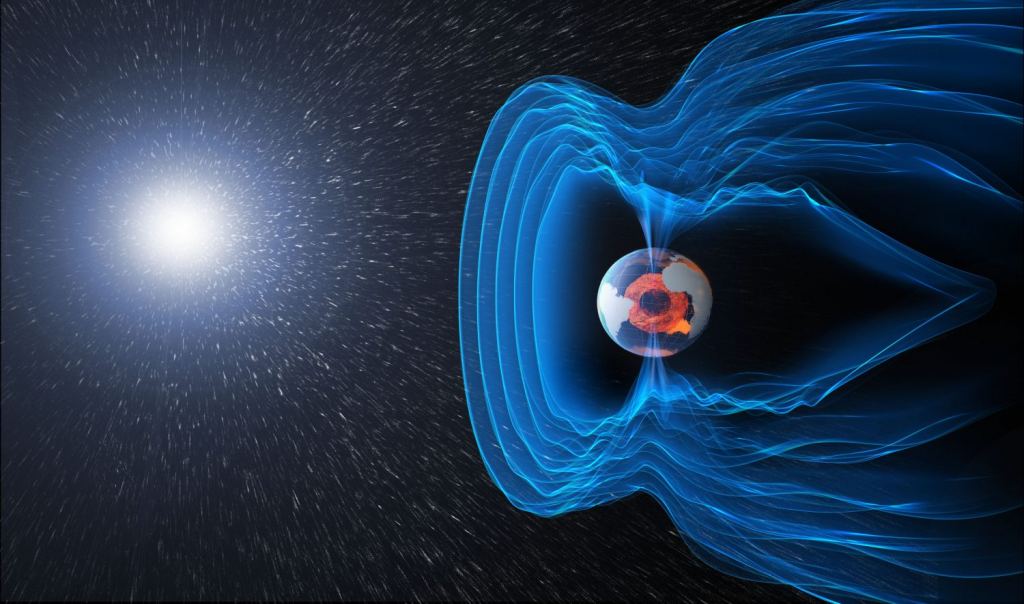
Earth’s protective shield. Credits: ESA/ATG medialab

NASA and the ESA are also developing next-generation space suits to provide improved protection against deep-space radiation, including NASA’s Exploration Extravehicular Mobility Unit (xEMU). The ESA also sent two mannequins developed by the German Aerospace Center (DLR) to space as part of the Artemis I mission, which conducted a circumlunar test flight between November 16th to December 11th, 2022. These mannequins, nicknamed Helga and Zohar, were studded with radiation sensors provided by NASA and the DLR, while one (Zohar) wore a protective radiation vest.

The data obtained during this test flight will help inform future spacesuits developed for ESA crews. Said Colin Wilson, ExoMars TGO project scientist:

“Space radiation can create a real danger to our exploration throughout the Solar System. Measurements of high-level radiation events by robotic missions is critical to prepare for long-duration crewed missions. Thanks to data from missions like ExoMars TGO we can prepare for how best to protect our human explorers.”

Further Reading: ESA, Geophysical Research Letters

The post A Massive Solar Storm was Detected on Earth, Mars, and the Moon appeared first on Universe Today.


Yes! A JWST Image of the Ring Nebula

Brace yourselves for great JWST views of the iconic Ring Nebula (M57). An international team of astronomers just released a fantastic near-infrared image of the nebula, showing incredible details.

The Ring is a planetary nebula in the constellation Lyra and is what’s left over at the death of sun-like star. The star in the center blew all its material away to space, which is what we see as the ring. The star itself is now becoming a white dwarf.

Astronomers have long been fascinated by this form of star death because it shows what will happen to the Sun in about 5 billion years. Albert Zijlstra, Professor in Astrophysics at the University of Manchester, said of the JWST view, “We are amazed by the details in the images, better than we have ever seen before. We always knew planetary nebulae were pretty. What we see now is spectacular.”

Planetary nebulae exist throughout the galaxy. Each one is different, and they have many shapes. Some have glowing rings, others show bubble-like structures, while others look like butterflies and wispy phantoms. In the case of the Ring Nebula, it’s really more like a jelly donut or bagel in shape, which gives some tantalizing clues to its past. Astronomers can trace the chemical elements in planetary nebulae by studying the light they emit in great detail. Those elements tell the tale of the star’s evolution through time.

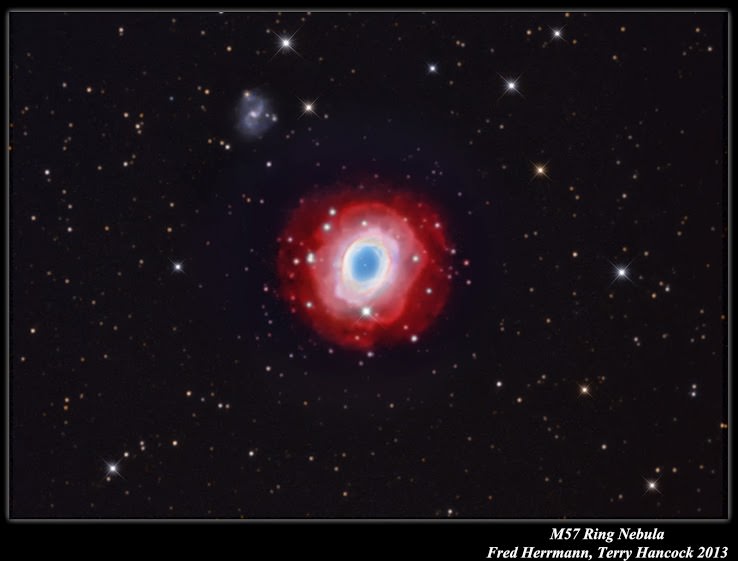
M57 (the Ring Nebula) 'deep version' taken by by amateur astronomers Terry Hancock of Michigan and Fred Herrmann of Alabama who both used Astro-Tech 12 inch Ritchey-Chrétien astrographs.
M57 (the Ring Nebula) is accessible to amateur astronomers with good cameras. This ‘deep version’ taken by by amateur astronomers Terry Hancock of Michigan and Fred Herrmann of Alabama, who both used Astro-Tech 12 inch Ritchey-Chrétien astrographs.

An Infrared View of the Ring Nebula

In this case, JWST looked at the ring in near-infrared light using its NIRCam instrument. It’s sensitive to light that ranges from 0.6 to 5 microns (600-5000 nanometers). The human eye can see a little into the infrared, to perhaps around 0.7 microns (700 nm), so JWST extends our vision to realms where we can’t see.

According to Mike Barlow, lead scientist of the JWST Ring Nebula Project, the high-resolution views really tell much more of the Ring’s story as the star moved through its life cycle. “The high-resolution images not only showcase the intricate details of the nebula’s expanding shell but also reveal the inner region around the central white dwarf in exquisite clarity,” he said. “We are witnessing the final chapters of a star’s life, a preview of the Sun’s distant future so to speak, and JWST’s observations have opened a new window into understanding these awe-inspiring cosmic events. We can use the Ring Nebula as our laboratory to study how planetary nebulae form and evolve.”

Colors and Details

In the JWST view, colors coding shows temperatures of the ejected material at different distances from the star. Those clouds of gas and dust glow thanks to ultraviolet light streaming away from the stellar remnant. The star itself is about 100,000 degrees, which heats up the nearby clouds quite well. The rest of the material lies further out and is much cooler. Astronomers estimate that the star began ejecting its outer layers at least 4,000 years ago. Based on earlier observations, including those by Hubble Space Telescope, the outer parts of the nebula appear to be expanding at a rate of about 20 kilometers per second and is just slightly over a light-year across.

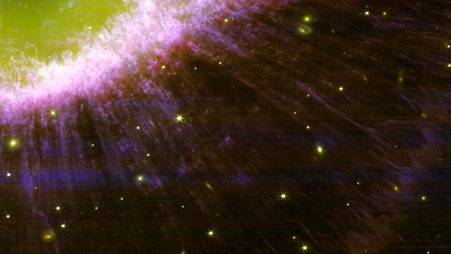
A close-up of the central region of the Ring Nebula. The brightest star is the very hot progenitor of the nebula. Courtesy JWST Ring Nebula Project.

Astronomers can see more details in the nebula using the JWST’s infrared-sensitive capabilities. For example, NIRCam can peer through any surrounding dust clouds to zero in on structures in the nebula. It can also detect any material that glows in infrared light. In JWST’s view, we can now see thin streamers of material at the edges of the nebula in more detail. In addition, it identifies faint structures in the ring itself. Astronomers will study those closely to figure out what caused them.

A close-up of the outer halo of the Ring Nebula, with linear features stretching out from the main body. Courtesy JWST Ring Nebula Project.

Origin and Evolution of the Ring Nebula

The colors of the Ring are well-known from many astrophotographs, as well as views from both ground-based and orbiting telescopes. Perhaps the most famous recent view came from the Hubble Space Telescope in 2013. It shows a great deal of colorful detail, including some strange-looking “cometary knots”. Those were created as material was cast away from the star. In HST’s view, blue colors indicate hot helium emission lines, green indicates ionized oxygen, and red is ionized nitrogen.

Hubble image of the Ring Nebula (aka. Messier 57). Credit: NASA/ESA/ Hubble Heritage (STScI/AURA) – ESA /Hubble Collaboration

Those colors and structures tell an interesting tale about the evolution of the Ring Nebula’s star, according to astronomer Nick Cox, a project co-leader. “These images hold more than just aesthetic appeal; they provide a wealth of scientific insights into the processes of stellar evolution. By studying the Ring Nebula with JWST, we hope to gain a deeper understanding of the life cycles of stars and the elements they release into the cosmos,” he said.

The Ring Nebula has been a case study in planetary nebulae for more than a century. Here’s what astronomers know about its origins. The progenitor star was several times more massive than the Sun. It spent much of its life doing what stars do: converting hydrogen to helium in the core. About 4,000 years ago, it ran out of hydrogen and began converting helium in its core. That caused the star to heat up and it ballooned out to become a red giant. As it did, it shed its outer layers to space. Ultraviolet light from the now-collapsing star heats up the gases, causing them to glow. The result, after several thousand years is the Ring Nebula we now see through our telescopes.

More Images to Come

The JWST NIRCam images aren’t the only ones of the Ring JWST has taken. More taken with MIRI (another infrared instrument) will be released soon. The team of astronomers working on this project hail from UK, France, Canada, USA, Sweden, Spain, Brazil, Ireland and Belgium.

For More Information

James Webb Space Telescope Captures Stunning Images of the Ring Nebula

Manchester Astronomer Captures Stunning Images of the Ring Nebula on James Webb Space Telescope

The post Yes! A JWST Image of the Ring Nebula appeared first on Universe Today.


JWST is the Perfect Machine to Resolve the Hubble Tension

You’ve just found the perfect work desk at a garage sale, and you measure it to see if it will fit in your apartment. You brought a tape measure to size it up and find it’s 180 cm. Perfect. But your friend also brought a tape measure, and they find it’s 182 cm, which would be a smidge too long. You don’t know which tape measure is right, so you have a conundrum. Astronomers also have a conundrum, and it’s known as the Hubble tension.

Astronomers have several ways to measure the size of the universe. They can look at fluctuations in the cosmic background, the wavelengths of microwave laser light emanating from around black holes, the brightness of distant supernovae, and so on. Each of these is an independent way of measuring distance. An independent ruler, if you will. It turns out they don’t all agree, and because of this, they yield different measures for the rate of cosmic expansion, known as the Hubble parameter. The values they get for the Hubble parameter are all in the same general ballpark, but not exactly the same, hence the term Hubble tension.

The results do tend to cluster into two values. Observations of the cosmic background and a few others give a value of around 67 – 68 (km/s)/Mpc. Observations of distant supernovae give a value of around 71 – 75 (km/s)/Mpc. There isn’t a clear way to resolve this tension. On the one hand, the first group of observations generally relies on fewer model assumptions, and are more direct measures of cosmic scale. On the other hand, the second measure relies on a multiple-stage process known as the cosmic distance ladder. It’s more complex but draws upon a long history of excellent astronomical measurements. This new work focuses on the second approach, specifically looking at whether our measurements of the cosmic distance ladder are biased.

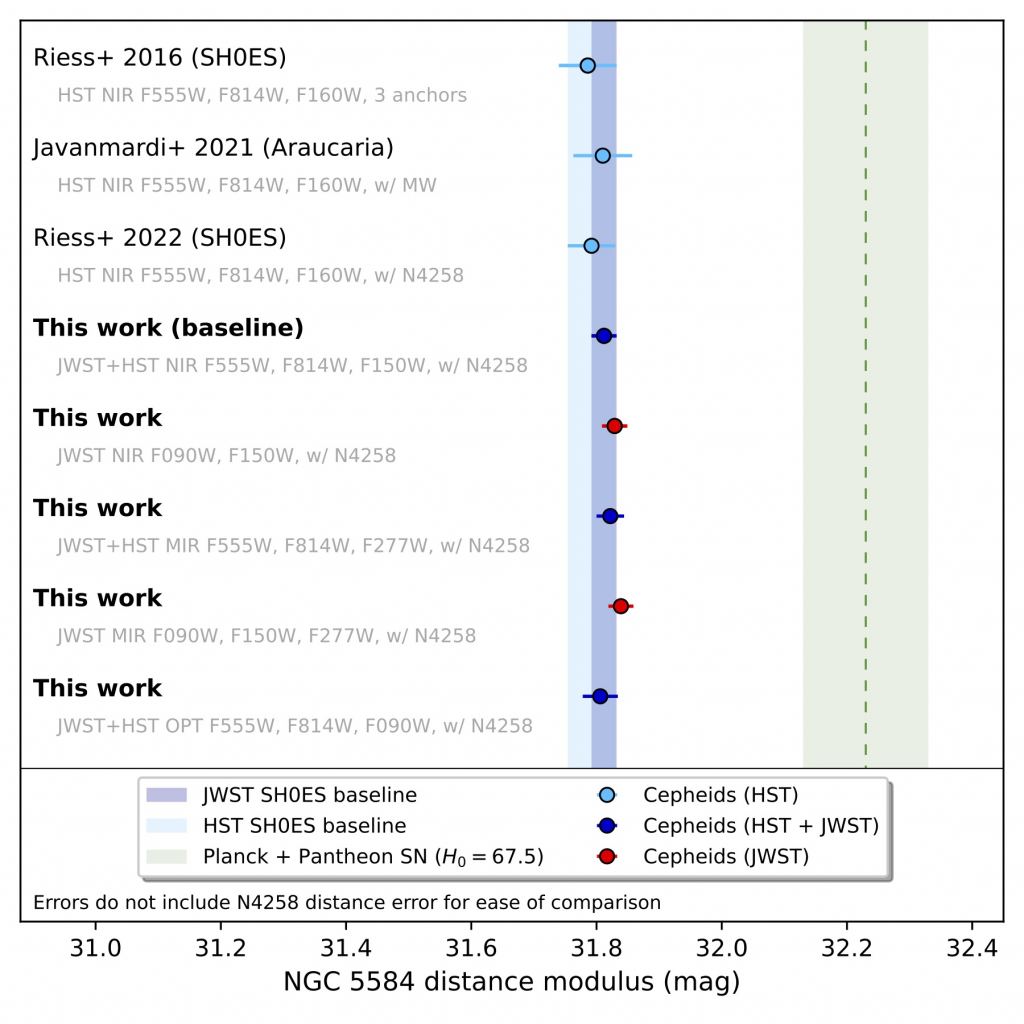
Cepheid measures of Hubble and JWST compared. Credit: Riess, et al

Very broadly, the cosmic distance ladder uses three rungs of measurement. The first rung is parallax, where we use simple geometry to measure stellar distances, which is extremely accurate. The second rung looks at a type of variable star known as Cepheid variables. Their rate of oscillation correlates with their overall brightness. The third rung measures the apparent brightness of Type Ia supernovae, which always explode with consistent brightness. So we use parallax to measure Cepheid distances, use that to scale their pulse rate to overall brightness, then use Cepheid pulses to measure supernova distances, from which we get the actual brightness of Type Ia supernovae. Then when we see a supernova in a distant galaxy, we can use its apparent brightness to calculate galactic distance.

One proposed solution to the Hubble tension suggests that perhaps our scale for Cepheid variables is wrong. While we can measure parallax distances for lots of Cepheids, measuring brightness can be a challenge. When a Cepheid variable is near several other stars, it can be difficult to separate its brightness from the background brightness of nearby stars. It’s an effect known as crowding and could be skewing our data.

To determine whether this bias is significant, the team compared observations of Cepheids made by the Hubble Space Telescope with observations from the James Webb Space Telescope. The Hubble observations have long been the basis of the Cepheid rung of the cosmic distance ladder, but since JWST observes Cepheids at infrared wavelengths, clustering is less of a problem. The team used 560 Cepheid measures from Hubble and 325 Cepheid measures from JWST.

They found that JWST observations increased the precision of the Cepheid scale, but the overall scale was not changed. In other words, the clustering issue seen in Hubble data does not significantly bias the cosmic distance ladder. So this doesn’t resolve the Hubble tension. The new results actually make the tension slightly worse, because the Cepheid scale is now more precise.

So much for that idea. But there’s still a bit of hope. As JWST gathers observations of distant supernova, the third rung of the cosmic distance ladder can be tested to see if there’s bias there.

Reference: Riess, Adam G., et al. “Crowded No More: The Accuracy of the Hubble Constant Tested with High Resolution Observations of Cepheids by JWST.” arXiv preprint arXiv:2307.15806 (2023).

The post JWST is the Perfect Machine to Resolve the Hubble Tension appeared first on Universe Today.


Thursday, August 3, 2023

China’s Chang’e-7 Will Deploy a Hopper that Jumps into a Crater in Search of Water Ice

Researchers from the Chinese Academy of Sciences and the Chinese National Space Administration recently published a study in the journal Space: Science & Technology outlining how the upcoming Chang’e-7 mission, due to launch in 2026, will use a combination of orbital observations and in-situ analyses to help identify the location, amount, and dispersion of water-ice in the permanently-shadowed regions (PSRs) of the Moon, specifically at the lunar south pole.

Once the orbiter successfully achieves lunar orbit, it will deploy the lander and mini-flying probe designed to perform in-situ analyses of lunar water-ice while the orbiter is expected to conduct remote observations using a variety of instruments.  

The paper discusses how the mini-flying probe, which will be equipped with a water molecular analyzer to collect lunar surface frost water molecules, will be capable of flying from the sunlit regions on the lunar south pole to the dark bottom of the impact craters within the PSRs. The mini-flying probe will also include a drilling tool, mechanical arm, and heating furnace for conducting spectral analyses of lunar water-ice, as well. An enormous benefit to the mini-flying probe will be its ability to travel to the bottom of impact craters, which conventional lunar rovers were never designed to do. The paper states the goal of the mini-flying probe’s analyses will be to hopefully identify water, ammonia, and additional volatiles at the bottom of these PSR craters.

While Chang’e-7 isn’t currently scheduled to launch until 2026, Chang’e-6 is scheduled to land on the far side of the Moon sometime in 2024 to collect samples and return them to Earth, which could serve as a systems test prior to Chang’e-7’s arrival in 2026. This will lead to the Chang’e-8 mission in 2028, which will work with Chang’e-7 in conducting experiments on in-situ resource utilization, or ISRU, with the goal of constructing an International Lunar Research Station. All these missions are a part of China’s ambitious blueprint for lunar robotic and human exploration, with the goal of landing Chinese astronauts on the Moon by 2030.

The reason lunar water-ice is so heavily pursued is its promise for helping establish a sustained human presence on the Moon, along with aiding in deep space human exploration, specifically to Mars. This is because combining ISRU with the presence of lunar water-ice will significantly reduce the need for constant resupply from Earth, which could reduce cost, time, and resources in sending water to the Moon.

There are several PSR impact craters at the lunar south pole that are current targets for water-ice exploration, specifically Shackleton Crater, which partially resides directly on the Moon’s south rotational pole. Its crater bottom has been permanently in the dark for billions of years, with only its mountainous rim being permanently bathed in sunlight. Despite this, portions of Shackleton’s interior were recently imaged in high-resolution by NASA’s ShadowCam, which is onboard Korea Pathfinder Lunar Orbiter from the Korea Aerospace Research Institute. ShadowCam has 200 times the light-gathering power than NASA’s Lunar Reconnaissance Orbiter Narrow Angle Camera, known for its high-resolution images of the lunar surface.

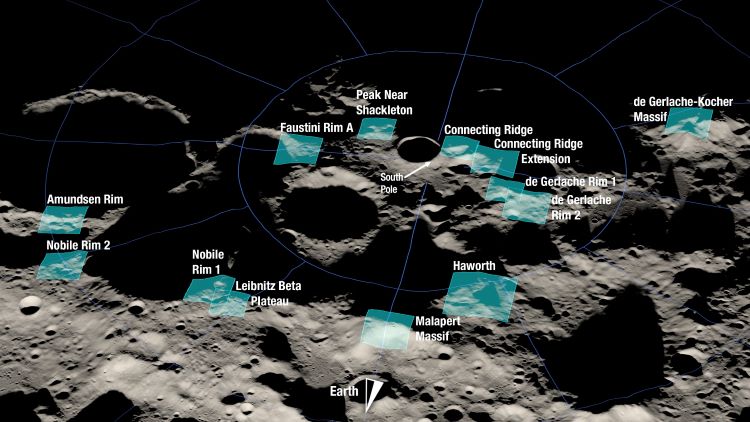
Along with China, the United States is amid its own rigorous human lunar exploration program with NASA’s Artemis, whose goal is to land the first woman and person of color on the lunar surface for the first time, along with being the first that humans will have set foot on the Moon since Apollo 17 in 1972. Like Chang’e-7, this historic landing is set to take part at the lunar south pole with the Artemis III mission, currently scheduled to take place in 2025, with NASA recently identifying 13 potential candidate landing sites at the south pole.

Composite image rendition of 13 candidate landing regions identified for NASA’s Artemis III human landing. Each region is approximately 15 by 15 kilometers (9.3 by 9.3 miles). A potential landing site within each region is comprised of a radius of approximately 100-meters (328-feet). (Credits: NASA)

How will China’s ambitious lunar exploration program play out in the nest few years, and will Chang’e-7 be successful in exploring the PSRs on the south pole of the Moon in preparation for future human landings? Only time will tell, and this is why we science!

As always, keep doing science & keep looking up!

The post China’s Chang’e-7 Will Deploy a Hopper that Jumps into a Crater in Search of Water Ice appeared first on Universe Today.