A Chandra X-ray Observatory view of the supermassive black hole at the heart of quasar H1821+643. Courtesy NASA/CXC/Univ. of Cambridge/J. Sisk-Reynés et al.
Black holes. They used to be theoretical, up until the first one was found and confirmed back in the late 20th Century. Now, astronomers find them all over the place. We even have direct radio images of two black holes: one in M87 and Sagittarius A* in the center of our galaxy. So, what do we know about them? A lot. But, there’s more to find out. A team of astronomers using Chandra X-ray Observatory data has made a startling discovery about a central supermassive black hole in a quasar embedded in a distant galaxy cluster. What they found provides clues to the origin and evolution of supermassive black holes.
Two-factor Identification of Black Holes
If you’re going to study a black hole, particularly a supermassive one, there are a lot of challenges. It turns out every large galaxy has a central monster black hole. So, it’s important to know as much as we can about them. These cosmic behemoths contain millions or even billions of solar masses. They have strong gravitational pulls—and nothing, not even light, can escape their clutches. That affects our ability to look at them and their nearby regions.
One thing that isn’t quite clear yet: how do these monsters form and evolve? The answer lies partially in two of their characteristics. “Every black hole can be defined by just two numbers: its spin and its mass,” said Julia Sisk-Reynes {Institute of Astronomy (IoA), the University of Cambridge in the U.K), who led a new study of a supermassive black hole some 3.6 billion years away from us. “While that sounds fairly simple, figuring those values out for most black holes has proved to be incredibly difficult.”
X-raying a Black Hole
Measuring the masses is difficult, although there are ways to do it. Measuring spin is a real challenge. To learn more about monster black holes, Sisk-Reynes and collaborators used Chandra X-ray Observatory data. They studied observations of the central supermassive black hole engine of the quasar H1821+643 and possibly get its spin rate. It contains 30 billion times the mass of the Sun. (By comparison, the Milky Way’s central supermassive black hole has only about four billion solar masses.)
Why X-rays? A spinning black hole drags space around with it and allows matter to orbit closer to it than is possible for a non-spinning one. X-ray data shows how fast the black hole spins. Studies of the spectrum of H1821+643 show that its black hole rotation rate is weird, compared to other less massive ones that spin at close to the speed of light. That slower rate for the quasar’s black hole surprised the team.
This composite image of H1821+643 contains X-rays from Chandra (blue) that have been combined with radio data from NSF’s Karl G. Jansky Very Large Array (red) and an optical image from the PanSTARRS telescope on Hawai’i (white and yellow). The researchers used nearly a week’s worth of Chandra observing time, taken over two decades ago, to obtain this latest result. The supermassive black hole is located in the bright dot in the center of the radio and X-ray emission.
“We found that the black hole in H1821+643 is spinning about half as quickly as most black holes weighing between about a million and ten million suns,” said astronomer Christopher Reynolds (also of the Institute of Astronomy). He is co-author of the paper reporting the results of the Chandra measurements. “The million-dollar question is: why?”
Black Holes: Origin and Evolution
The history of H1821+643 could hold the key to understanding its slower spin rate, according to co-author James Matthews (also at the Institute of Astronomy). He suggests that supermassive black holes like the one in H1821+643 likely grew through mergers with other black holes during collisions of their galaxies. It’s well known that galaxy collisions build up larger galaxies over time, and so those same activities (including collisions of dwarf galaxies) are fair game as possible factors.
It’s also possible that this black hole had its outer disk disrupted in a collision, which sent gas out in random directions during the event. These kinds of activities would affect the spin rate of the black hole—slowing it down, or even torquing it around in an entirely new direction. That means such black holes could show a range of spin rates, depending on their recent histories.
“The moderate spin for this ultramassive object may be a testament to the violent, chaotic history of the universe’s biggest black holes,” Matthews said. “It may also give insights into what will happen to our galaxy’s supermassive black hole billions of years in the future when the Milky Way collides with Andromeda and other galaxies.”
Within the Solar System, most of our astrobiological research is aimed at Mars, which is considered to be the next-most habitable body beyond Earth. However, future efforts are aimed at exploring icy satellites in the outer Solar System that could also be habitable (like Europa, Enceladus, Titan, and more). This dichotomy between terrestrial (rocky) planets that orbit within their a system’s Habitable Zones (HZ) and icy moons that orbit farther from their parent stars is expected to inform future extrasolar planet surveys and astrobiology research.
In fact, some believe that exomoons may play a vital role in the habitability of exoplanets and could also be a good place to look for life beyond the Solar System. In a new study, a team of researchers investigated how the orbit of exomoons around their parent bodies could lead to (and place limits on) tidal heating – where gravitational interaction leads to geological activity and heating in the interior. This, in turn, could help exoplanet-hunters and astrobiologists determine which exomoons are more likely to be habitable.
The research was conducted by graduate student Armen Tokadjian and Professor Anthony L. Piro from the University of Southern California (USC) and The Observatories of the Carnegie Institution for Science. The paper that describes their findings (“Tidal Heating of Exomoons in Resonance and Implications for Detection“) recently appeared online and has been submitted for publication in the Astronomical Journal. Their analysis was inspired largely by the presence of multiplanet moon systems in the Solar System, such as those that orbit Jupiter, Saturn, Uranus, and Neptune.
Illustration of Jupiter and the Galilean satellites. Credit: NASA
In many cases, these icy moons are believed to have interior oceans resulting from tidal heating, where gravitational interaction with a larger planet leads to geological action in the interior. This, in turn, allows for liquid oceans to exist due to the presence of hydrothermal vents at at the core-mantle boundary. The heat and chemicals these vents release into the oceans could make these “Ocean Worlds” potentially habitable – something scientists have been hoping to investigate for decades. As Tokadjian explained to Universe Today via email:
“In terms of astrobiology, tidal heating may boost the surface temperature of a moon to a range where liquid water can exist. Thus even systems outside the habitable zone may warrant further astrobiological studies. For example, Europa hosts a liquid ocean due to tidal interactions with Jupiter, although it lies outside the Solar System’s ice line.”
Considering how plentiful “Ocean Worlds” are in the Solar System, it is likely that similar planets and multi-moon systems can be found throughout our galaxy. As Piro explained to Universe Today via email, the presence of exomoons has a lot of important implications for life, including:
Large moons like our own can stabilize the planet’s axial tilt, so the planet has regular seasons
Tidal interactions can prevent planets from tidally locking with their host star, impacting the climate
Moons can tidally heat a planet, helping it maintain a molten core, which has many geological implications
When a gaseous planet is in the habitable zone of a star, the moon itself can host life (think of Endor or Pandora)
In recent decades, geologists and astrobiologists have theorized that the formation of the Moon (ca. 4.5 billion years ago) played a major role in the emergence of life. Our planetary magnetic field is the result of its molten outer core rotating around a solid inner core and in the opposite direction of the planet’s own rotation. The presence of this magnetic field shields Earth from harmful radiation and is what allowed our atmosphere to remain stable over time – and not slowly stripped away by solar wind (which was the case with Mars).
An amazingly active Io, Jupiter’s “pizza moon,” shows multiple volcanoes and hot spots in this photo taken with Juno’s infrared camera. Credit: NASA/JPL-Caltech /SwRI/ASI/INAF/JIRAM/Roman Tkachenko
In short, the interactions between a planet and its satellites can affect the habitability of both. As Tokadjian and Piro showed in a previous paper using two candidate exoplanets as an example (Kepler-1708 b-i and Kepler-1625 b-i), the presence of exomoons can even be used to explore the interior of exoplanets. In the case of multi-moon systems, said Tokadjian and Piro, the amount of tidal heating depends on several factors. As Piro illustrated:
“As a planet raises tides on a moon, some of the energy stored by the deformation is transferred into heating the moon. This process is dependent on many factors, including the interior structure and size of the moon, the mass of the planet, planet-moon separation, and the moon’s orbital eccentricity. In a multi-moon system, the eccentricity can be excited to relatively high values if the moons are in resonance, leading to significant tidal heating.”
“In Armen’s work, he nicely shows, in analogy to the tidal heating we see for Io around Jupiter, that resonant interactions between multiple moons can efficiently heat exomoons. By ‘resonant,’ we mean the case where the periods of moons obey some integer multiple (like 2 to 1 or 3 to 2) so that their orbits gravitationally ‘kick’ each other regularly.”
In their paper, Tokadjian and Piro considered moons in a 2:1 orbital resonance around planets of varying size and type (i.e., smaller rocky planets to Neptune-like gas giants and Super-Jupiters). According to their results, the largest tidal heating will occur in moons that orbit rocky Earth-like planets with an orbital period of two to four days. In this case, the tidal luminosity was over 1000 times that of Io, and the tidal temperature reached 480 K (~207 °C; 404 °F).
Artist’s impression of the view from a hypothetical moon around an exoplanet orbiting a triple star system. Credit: NASA
These findings could have drastic implications for future exoplanet and astrobiology surveys, which are expanding to include the search for exomoons. While missions like Kepler have detected many exomoon candidates, none have been confirmed since exomoons are incredibly difficult to detect using conventional methods and current instruments. As Tokadjian explained, tidal heating could offer new methods for exomoon detection:
“First, we have the secondary eclipse method, which is when a planet and its moon move behind a star resulting in a dip in stellar flux observed. If the moon is significantly heated, this secondary dip will be deeper than what is expected from the planet alone. Second, a heated moon will likely expel volatiles like sodium and potassium through volcanism much like the case of Io. Detecting sodium and potassium signatures in the atmospheres of exoplanets can be a clue for exomoon origin.”
In the coming years, next-generation telescopes like the James Webb (which will be releasing its first images on July 12th) will rely on their combination of advanced optics, IR imaging, and spectrometers to detect chemical signatures from exoplanet atmospheres. Other instruments like the ESO’s Extremely Large Telescope (ELT) will rely on adaptive optics that will allow for Direct Imaging of exoplanets. The ability to detect chemical signatures of exomoons will greatly increase their ability to find potential signs of life!
Making a 3D map of our galaxy would be easier if some stars behaved long enough to get good distances to them. However, red supergiants are the frisky kids on the block when it comes to pinning down their exact locations. That’s because they appear to dance around, which makes pinpointing their place in space difficult. That wobble is a feature, not a bug of these massive old stars and scientists want to understand why.
So, as with other challenging objects in the galaxy, astronomers have turned to computer models to figure out why. In addition, they are using Gaia mission position measurements to get a handle on why red supergiants appear to dance.
Artist’s impression of the red supergiant star Betelgeuse as it was revealed with ESO’s Very Large Telescope. It shows a boiling surface and material shed by the star as it ages. Credit: ESO/L.Calçada
Understanding Red Supergiants
The population of red supergiants has several common characteristics. These are stars at least eight times the mass of the Sun, and they’re enormous. A typical one is at least 700 to 1,000 times the solar diameter. At 3500 K, they’re much cooler than our ~6000 K star, although measuring those temperatures is tricky. They are super bright in infrared light, but dimmer in visible light than other stars. They also vary in their brightness which (for some of them) may be related to that dancing motion. More on that in a moment.
If the Sun was a red supergiant, Earth wouldn’t be around. That’s because the star’s atmosphere would have reached out to Mars and swallowed our planet up. The best-known examples of these stellar behemoths are Betelgeuse and Antares. Red supergiants exist throughout the galaxy. There’s a population of them you can see at night in a nearby cluster called Chi Persei. It’s part of the well-known “Double Cluster”.
The Structure of Red Supergiants
So, we have this population of stars that don’t behave as expected and don’t lend themselves to easy measurements. Why is that? They’ve expanded so much that they end up with a very low surface gravity. Because of that, their convective cells (the structures that carry heat from inside to the surface) get pretty large. One cell covers as much as 20-30 percent of the radius of the star. That actually “interrupts” the brightness of the star.
The convection not only moves heat from the inside out, but also helps the star eject material into nearby space. And, we’re not talking small poofs of gas and plasma, either. A red supergiant can send a billion times more mass to space than the Sun does. All that action makes the star appear frothy and like its surface is boiling madly. In essence, it makes the star’s position appear to dance in the sky.
Red Supergiants in the Grand Scheme of Things
Red supergiant material becomes part of the chemical “inventory” of galaxies. The elements these stars create go on to become new stars and worlds. So, it helps to get a good understanding of how these stars lose their mass throughout their lives. It’s all part of understanding stellar evolution in the Milky Way and its impact on the cosmic environment. That’s why astronomers want to trace the total mass that these aging stars blow out to space. They also measure the stellar wind velocity and calculate the geometry of the cloud of “star stuff” that envelopes a red supergiant.
Now, what does this have to do with the dancing action? Well, the boiling of the convection cells and the buildup of a shell of material around the star adds to its variability. That is, it affects its brightness over time.
One way that astronomers use to determine a star’s exact position is by using its “photo-center”. That’s the center of light of the star. If the star varies in brightness (for whatever reason), that photo-center shifts. It won’t match the barycenter. (That’s the common center of gravity between the star and the rest of its system. It is a component in distance measurements.) In essence, the photo-center varies as the star’s brightness changes. Combined with the action of the huge convection cells, the star appears to dance in space.
A video of the simulation of a red supergiant surface shows that the constantly changing photosphere of the star (big image) leads to changes in the apparent position of the star’s center (small image at lower left). Credit: A. Chiavassa, Tl Grassi, et al.
The Dance Changes the Distance Estimate
The red supergiant “position problem” attracted Andrea Chiavassa (Laboratoire Lagrange, the Exzellenzcluster ORIGINS, and the Max Planck Institute for Astrophysics). She and astronomer Rolf Kudritzki (Munich University of Observatory and the Institute of Hawai’i) and a science team created simulations of the boiling surfaces and variability of red supergiant brightness.
“The synthetic maps show extremely irregular surfaces, where the largest structures evolve on timescales of months or even years, while smaller structures evolve over the course of several weeks,” said Chiavassa. “This means that the position of the star is expected to change as a function of time.”
The team compared their model to stars in Chi Persei. That cluster was measured by the Gaia satellite, so the positions of most of its stars are very precise. Well, all but the red supergiants. “We found that the position uncertainties of red supergiants are much larger than for other stars. This confirms that their surface structures change dramatically with time as predicted by our calculations”, explained Kudritzki.
This change in observable position provides a solution to understanding the shifting positions of red supergiants. That, in turn, presents difficulties in measuring exact distances to many of these stars. The current model also gives clues to the evolution of these objects. But, knowing what’s causing the stars to dance offers a path to a solution when calculating their distances. Future models will help astronomers refine those distances, and provide more insight into what’s happening to these stars as they age.
Stars form inside massive clouds of gas and dust called molecular clouds. The Nebular Hypothesis explains how that happens. According to that hypothesis, dense cores inside those clouds of hydrogen collapse due to instability and form stars. The Nebular Hypothesis is much more detailed than that short version, but that’s the basic idea.
The problem is that it only explains how single stars form. But about half of the Milky Way’s stars are binary pairs or multiple stars. The Nebular Hypothesis doesn’t clearly explain how those stars form.
Most stars about the same mass as our Sun or larger aren’t single stars. Most are members of multiple star systems, especially binary stars. While the nebular theory explains how single stars form, there are competing theories for how multiple stars form.
First of all, after a molecular cloud collapses into a star, it forms a rotating disk of gas and dust around the young protostar, called a circumstellar disk. One theory explaining how multiple stars form says that a pair or more of young protostars are fragments of a parent disk that was once much larger. Another theory says that the young protostars form independently, then one captures the other in an orbital arrangement.
T Tauri stars are less than 10 million years old and represent the type of young stars found in stellar nurseries like the Orion Cloud Complex. It shows the disc surrounding the young star, out of which planets will eventually form. The researchers behind this new study examined the dense cores that form young stars like this to find differences between cores that formed multiple stars and those that formed single stars like our Sun. Image Credit: ALMA (ESO/NAOJ/NRAO)
But when stars form inside a molecular cloud, it begins with a dense core inside the cloud. That core initiates the gravitational collapse that gathers enough gas in one place to form a star. The question is, what’s different about some of those cores that cause multiple stars to form versus single stars?
The JCMT is a 15-meter radio telescope at Mauna Kea Observatory in Hawaii. The telescope’s submillimeter observations allow it to observe the molecular clouds where stars are born. The researchers used it to observe the Orion Molecular Cloud Complex (OMCC), the closest active stellar nursery to Earth, which is still about 1500 light-years away. The OMCC contains two giant molecular clouds (GMCs), Orion A and Orion B. They also used observations from ALMA and Japan’s Nobeyama Telescope.
“During the transition phase from a prestellar to a protostellar cloud core, one or several protostars can form within a single gas core,” the paper stars. “The detailed physical processes of this transition, however, remain unclear.”
For this study, the team of researchers collected observations of 43 protostellar cores in the Orion molecular cloud complex with the JCMT. Then they used the powerful ALMA telescope to examine the interior structure of the cores.
This image shows the G205.46-14.56 clump located in the Orion Molecular Cloud Complex. The yellow contours show the dense cores discovered by JCMT, and the zoomed-in pictures show the 1.3mm continuum emission of ALMA observation. These observations give insight into the formation of various stellar systems in dense cores. Image Credit: Qiuyi Luo et al. 2022.
The research shows that about 30% of the 43 dense cores form binary or multiple stars, and the remainder forms only single stars. The astronomers measured and estimated the sizes and masses of the cores. They found that binary/multiple cores have higher densities and masses, although the sizes of all the cores aren’t much different.
This figure from the study shows the exemplar core G196.92-10.37. (a) is a JCMT image with a Spitzer image superimposed on it. The yellow circle is the zoomed-in region in (b.) (b) shows continuum contour levels. (c) shows ALMA data and also indicates that the core is forming three stars: A, B, and C. Image Credit: Qiuyi Luo et al. 2022.
“This is understandable,” said first author Qiuyi Luo. “Denser cores are much easier to fragment due to the perturbations caused by self-gravity inside molecular cores.”
From there, the team turned to Japan’s 45-meter Nobayama radio telescope. They observed what’s known as the N2H+ J=1-0 molecular line in all 43 dense cores. N2H+ is diazenylium, one of the first ions ever found in interstellar clouds. This molecular line is easily observed through Earth’s atmosphere with fine precision. Astronomers use it to map the density and velocity of the gas in molecular clouds.
Those observations showed that dense cores that form multiple stars are more turbulent than cores that form single stars.
This figure from the study shows the Mach number for gas in the dense cores as measured with the N2H+ line. Higher Mach numbers mean more turbulence, and this figure shows that binary and multiple star cores are more turbulent than cores forming single stars. Image Credit: Qiuyi Luo et al. 2022.
“These Nobeyama observations provide a good measurement of turbulence levels in dense cores. Our findings indicate that binary/multiple stars tend to form in more turbulent cores,” said Prof. Ken’ichi Tatematsu, who led the Nobeyama observations.
Lead author Qiuyi Luo summarized the study’s findings in a press release. “In a word, we found that binary/multiple stars tend to form in denser and more turbulent molecular cores in this study.”
This figure from the study shows the gas velocity in two of the dense cores. Blue indicates lower velocity, and red indicates higher velocity. The arrows show the directions of the local increasing velocity gradients, with the lengths indicating their magnitudes. The top core, labelled in orange, is a binary core, and the bottom core, labelled in black, is a single core. Image Credit: Qiuyi Luo et al. 2022.
Co-author Sheng-Yuan Liu added, “The JCMT has proven to be a great tool for uncovering these stellar nurseries for ALMA follow-ups. With ALMA providing unprecedented sensitivity and resolution so that we can do similar studies toward a much sample of larger dense cores for a more thorough understanding of star formation.”
The researchers also found that the stars in each binary or multiple arrangement are usually at very different evolutionary stages. The more evolved protostars are generally further from the center of the dense cores than their younger counterparts. This indicates that as stars evolve, they migrate out of their natal cores.
This study shows some differences between cores that form single stars versus cores that form binary and multiple stars. But it’s only the beginning: there’s much more to learn and many more questions.
One of the questions is what role do magnetic fields play in star formation? Star-forming clouds can be highly magnetized. Magnetic fields from the interstellar medium thread their way through star-forming clouds, and astronomers know that magnetic fields can affect the star formation rate. Do they play a role in determining if a single star forms versus multiple stars?
This figure is from a separate study that simulated the effect of magnetic fields on star-forming regions. The left is a simulated star-forming region without a magnetic field, right is with a magnetic field. Each white circle is a protostar, and red indicates gas moving at high velocities. Without magnetism, the mass collapses into a central region with less outflowing gas. With magnetism, the protostars are more spread out, and more gas is escaping. This seems to indicate that magnetic fields inhibit the formation of dense structures. Image Credit: Krumholz and Federrath 2019.
“We have yet to look at the effect of magnetic fields in our analysis,” said corresponding author Tie Liu, who was also the lead for the ALMA observations. “Magnetic field may suppress the fragmentation in dense cores, so we are excited to focus the next stage of our research on this area using the JCMT.”
The authors point out that the low sample size hampers their results. Forty-three dense cores may not be enough data to draw conclusions from, especially because they’re all from the same molecular cloud. The study was also limited by the resolution of the various observatories and telescopes used in the study.
“Our results could be further tested using future higher spatial and spectral resolution observations toward a more complete dense core sample in various molecular clouds that are in widely different environments,” they conclude.
Magnetars are some of the most fascinating astronomical objects. One teaspoon of the stuff they are made out of would weigh almost one billion tons, and they have magnetic fields that are hundreds of millions of times more powerful than any magnetic that exists today on Earth. But we don’t know much about how they form. A new paper points to one possible source – mergers of neutron stars.
Neutron stars themselves are equally fascinating in their own right. In fact, magnetars are generally considered to be a specific form of neutron star, with the main difference being the strength of that magnetic field. There are thought to be about a billion neutron stars in the Milky Way, and some of them happen to come in binary pairs.
When they are gravitationally bound to one another, the stars enter a final dance of death, typically resulting in either a black hole or, potentially, one or both of them transforming into a magnetar. That process can take hundreds of millions of years to build up to a certain point when the actual explosion (or collapse) happens. But when it does, it’s spectacular, and a team of researchers thinks they found that that happened only a few weeks before they spotted it.
UT video describing magnetars.
More accurately, it happened around 228 million years ago, which is how far away the galaxy it happened in is. However, the light from this spectacular event reached the sensors at Pan-STARRs only a few weeks before it started observing that patch of the sky. And what makes this magnetar stand out from all the others scientists have found is how fast it is spinning.
Typically, neutron stars rotate thousands of times per minute, making their period on the order of milliseconds. But the magnetars scientists have found are distinct in that their rotational time is much slower, typically only once every two to ten seconds. But GRB130310A, as the new magnetar is now known, has a rotational period of 80 milliseconds, putting it closer to the order of neutron stars than the typical magnetar.
This discrepancy is probably due to the remarkably young age at which Zhang Binbin and his colleagues found this magnetar. It has yet to complete its rotational slowing, as many other observed magnetars had. But the fact that its rotational period is approaching the rate of neutron stars points to its potential starting point as one of those neutron stars itself.
Magnetars aren’t the only phenomena that can result from a merger of neutron stars, as described in this UT video.
That rotational slowing that GRB130310A is currently undergoing takes thousands of years, but eventually, magnetars fade away and become almost undetectable. An estimated 30 million dead magnetars are floating around the Milky Way, and at least some of those likely started with the same dramatic orbital periods as GRB130310A.
Another hint that the new magnetar was spawned from a neutron star merger was the lack of any precursor events that observatories might have picked up. There was no supernova, and no Gamma-ray burst, both of which typically precede the birth of a magnetar. So it appears the researchers happened upon a neutron star merger that they detected almost right as it happened.
There are other ways to detect neutron star mergers, such as by the gravitational waves they sometimes emit. It is unclear whether any other instrumentation was able to capture this merger to confirm that the event happened as the researchers hypothesize. But if it did, it’s another data point confirming the long-standing idea that magnetars are at least sometimes born from neutron star mergers. And plenty more observations of similar events throughout the universe will be available to help confirm or disprove that theory.
When white dwarfs go wild, their planets suffer through the resulting chaos. The evidence shows up later in and around the dying star’s atmosphere after it gobbles up planetary and cometary debris. That’s the conclusion a team of UCLA astronomers came to after studying the nearby white dwarf G238-44 in great detail. They found a case of cosmic cannibalism at this dying star, which lies about 86 light-years from Earth.
If that star were in the place of our Sun, it would ingest the remains of planets, asteroids, and comets out to the Kuiper Belt. That expansive buffet makes this stellar cannibalism act one of the most widespread ever seen.
“We have never seen both of these kinds of objects accreting onto a white dwarf at the same time,” said lead researcher Ted Johnson, a physics and astronomy graduate of UCLA. “By studying these white dwarfs, we hope to gain a better understanding of planetary systems that are still intact.”
An artist’s view of a white dwarf siphoning off debris from shattered worlds in its planetary system. Courtesy NASA/ESA, Joseph Olmstead (STScI)
Finding Evidence of Chaos at a Dying Star
Johnson was part of a team from UCLA, UC San Diego, and the University of Kiel in Germany working to study chemical elements detected in and around the white dwarf atmosphere. They used data from NASA’s retired Far Ultraviolet Spectroscopic Explorer, the Keck Observatory’s High-Resolution Echelle Spectrometer in Hawaii, and the Hubble Space Telescope’s Cosmic Origins Spectrograph and Space Telescope Imaging Spectrograph. The team found and measured the presence of nitrogen, oxygen, magnesium, silicon, and iron, as well as other elements.
The iron is particularly interesting since it makes up the cores of rocky planets like Earth or Mars. Its presence is a clue that terrestrial-type worlds once orbited G238-44. The presence of high amounts of nitrogen implies the system had a pool of icy bodies as well.
When White Dwarfs Strike
As stars like the Sun enter very old age, they leave behind burned-out cores called white dwarfs. Over billions of years, these remnants of dying stars slowly cool down. Before they get to that point, however, the actual death throes can be quite violent and messy. That’s when they cannibalize the worlds around them. The discovery of the “leftovers” of those planets, comets, and asteroids, in the atmosphere of G238-44 paints an ominous picture of our solar system’s future.
The evolution of our Sun as a dying star to become a red giant, then form a planetary nebula, and eventually end up as a white dwarf. That evolutionary process also also affects worlds and other objects in its system. Image Credit: ESO/S. Steinhofel
We can expect our Sun to go through the process starting in about five billion years. First, it will balloon out to become a red giant, swallowing up planets possibly out to the orbit of Earth. Then, it will lose its outer layers, forming what we call a “planetary nebula”. Once all that’s dissipated to space, what’s left is the massive, but tiny white dwarf.
The whole process will tear apart the solar system, ripping planets to shreds and scattering comets and asteroids. Any of those objects that come too close to the white dwarf Sun will get sucked in and destroyed. The scale of the destruction occurs fairly quickly if G238-44’s example is any clue. This study shows the shocking scale of the chaos. Within 100 million years after it entered its white dwarf phase, the dying star was able to capture and consume material from its nearby asteroid belt and its far-flung Kuiper belt–like regions.
The slow destruction of G238-44’s planetary system, with the tiny white dwarf at the center, surrounded by a faint accretion disk made up of pieces of shattered bodies falling onto the dead star. Any remaining asteroids form a thin stream of material surrounding the dying star. Larger gas giant planets may still exist in the system, and much farther out is a belt of icy bodies such as comets. The process of gobbling up the leftovers of its worlds commenced shortly after the star entered its white dwarf phase. Courtesy: NASA, ESA, Joseph Olmsted (STScI)
What Else This White Dwarf Reveals
Not only does this finding show what’s in our future, but it also supplies interesting insight into how other systems form. It offers clues to what they contain, and a peek at our own solar system’s past. For example, astronomers think that icy objects crashed into dry, rocky planets in our own infant solar system. That’s in addition to the rocky materials that helped create our planet. For G238-44, that means an interesting amalgamation of stuff from a variety of regions and the evidence shows it.
“The best fit for our data was a nearly two-to-one mix of Mercury-like material and comet-like material, which is made up of ice and dust,” Johnson said. “Iron metal and nitrogen ice each suggest wildly different conditions of planetary formation. There is no known solar system object with so much of both.”
A Dying Star Gives Other Clues
The death of this sun-like star and its penchant for gobbling up debris has another interesting twist. Billions of years ago, comets and asteroids likely delivered water to our planet, sparking the conditions necessary for life. According to Benjamin Zuckerman, UCLA professor of physics and astronomy, the combo of icy and rocky material detected raining onto G238-44 shows that other planetary systems may have icy reservoirs (like the Kuiper Belt and Oort Cloud). That’s in addition to rocky bodies such as Earth and the asteroids.
“Life as we know it requires a rocky planet covered with a variety of volatile elements like carbon, nitrogen, and oxygen,” Zuckerman said. “The abundances of the elements we see on this white dwarf appear to have come from both a rocky parent body and a volatile-rich parent body—the first example we’ve found among studies of hundreds of white dwarfs.”
It’s intriguing to think that our own Sun could be doing the same thing in a few billion years. Perhaps some future astronomer on a planet a few dozen light-years away will do the same study that Johnson and his team did—and spot the remains of Earth in the white dwarf Sun’s dying glow.
Mapping the interior of the ice giants is difficult, to say the least. Not only are they far away and therefore harder to observe, but their constant ice cover makes it extremely hard to detect what lies underneath. So scientists must devise more ingenious ways to see what’s inside them. A team from the University of Idaho, Cal Tech, Reed College, and the University of Arizona think they might have come up with a way – to look at the structure of Neptunes’ and Uranus’ rings.
This isn’t the first technique scientists have used, though. Previous efforts have attempted to use the common technique of photometry to detect oscillations on the planet’s surface. Those oscillations can then be correlated to the density of particular parts of the planet’s interior. While the technique worked well for Jupiter, the photometry data we have of the ice giants so far have proved insufficient to determine the same density profiles.
An alternative is using gravitational oscillations within the planet’s surface. In particular, there is a type of oscillation pattern known as a “normal mode.” This oscillation pattern happens when all parts of a system begin oscillating with the same sinusoidal frequency. And the gravitational effects of normal mode oscillations in the planet’s interior can be felt outside and reflected in the rings themselves.
UT video discussing planetary rings in the solar system
It also isn’t the first time patterns in a planet’s rings have been used to calculate its internal density. Saturn has a better-understood ring system than Uranus or Neptune, the two ice giants with known ring systems. Scientists have been performing seismological analyses on the Saturnian ring system for years using data from Voyager and Cassini. The result is a better understanding of some of the normal modes of the planet’s interior and, therefore, an estimate of the makeup of the planet’s core and the rotation rate of the bulk of its material.
Neptune and Uranus each have a series of different rings, though they are not as well studied as Saturn’s. Some of those rings of which are corralled by shepherd moons. But according to the new paper, the same density reflections of resonance waves evident in Saturn’s rings are likely present in the ice giant’s ring systems as well.
What’s more, the inner shepherd moons themselves might be affected by the same resonances. Some of the moons can even create their own resonances, such as one known as a Lindblad resonance. More typically seen on the scale of galaxies, Lindblad resonances are known for driving spiral density waves, which cause the “arms” that can be seen in many spiral galaxies. But at a much smaller scale, the same effect happens on planetary ring systems, including Saturn’s, and most likely, Neptune’s and Uranus’.
UT video describing the Trident mission, which would return to Neptune.
The problem with using these resonances reflected in the rings is one that often faces science – there’s not enough data. So far, no probe has stayed long enough to map out the details needed to see the full scope of the ring system. The paper’s authors and plenty of other researchers suggest that it’s time to send a probe to the ice giants to effectively map the ring systems, moons, and myriad other recently discovered objects that are so hard to observe from the Earth. But for now, that mission is still on the drawing board, so we’ll have to wait to fully understand the interiors and ring system of these cold, barren worlds. At least when we finally do send a probe out that way, we’ll have the mathematical framework to help shed light on these dark places.
When NASA sent the Mars Reconnaissance Orbiter (MRO) to the red planet in 2006, the spacecraft took an instrument with it called CRISM—Compact Reconnaissance Imaging Spectrometer for Mars. CRISM’s job is to produce maps of Mars’ surface mineralogy. It’s been an enormous success, but unfortunately, the loss of its last cryocooler in 2017 means the spectrometer can only undertake limited observations.
But CRISM is going out with a bang, creating one final image of the surface of Mars that NASA will release in batches over the next six months.
“It’s effectively a whole new data set that will fuel a second wave of discoveries about Mars’ surface composition.”
Scott Murchie, CRISM’s principal investigator, Johns Hopkins Applied Physics Laboratory (APL).
The new map will cover 86% of Mars’ surface. It’ll be 5.6 gigapixels in size and will reveal the locations of dozens of important minerals in 72 colours. Since many minerals form in the presence of water, the locations of certain minerals reveal evidence of Mars’ watery past. The new map will also help plan future missions and choose the most promising locations for rovers to visit.
Jezero Crater on Mars was the landing site for NASA’s Mars 2020 rover. The colours in this image show surface minerals detected by CRISM, which helped identify the crater as a desirable landing site. The green colour represents carbonates, which are good at preserving fossils. Image Credit: NASA/JPL-Caltech/ASU
We already have the first portions of the new map. The final version of the map will contain about 51,000 540-kilometre-long strips, contained in 1764 tiles. In mid-June, NASA released 48 of those tiles, and they cover five of Mars’ most scientifically interesting regions.
The final map is a whole new data set and the first of its kind. The data has been gathered over the mission’s years but has never been put together, though mission scientists had this project in the back of their minds. “We’ve had the map tiles as a product set on the books really from the very beginning,” said Frank Seelos, a planetary scientist at APL and lead on the CRISM mapping project. “We knew we wanted to do this, but it took us many, many years to get to the point where we had enough data and the tools needed to make it worthwhile.”
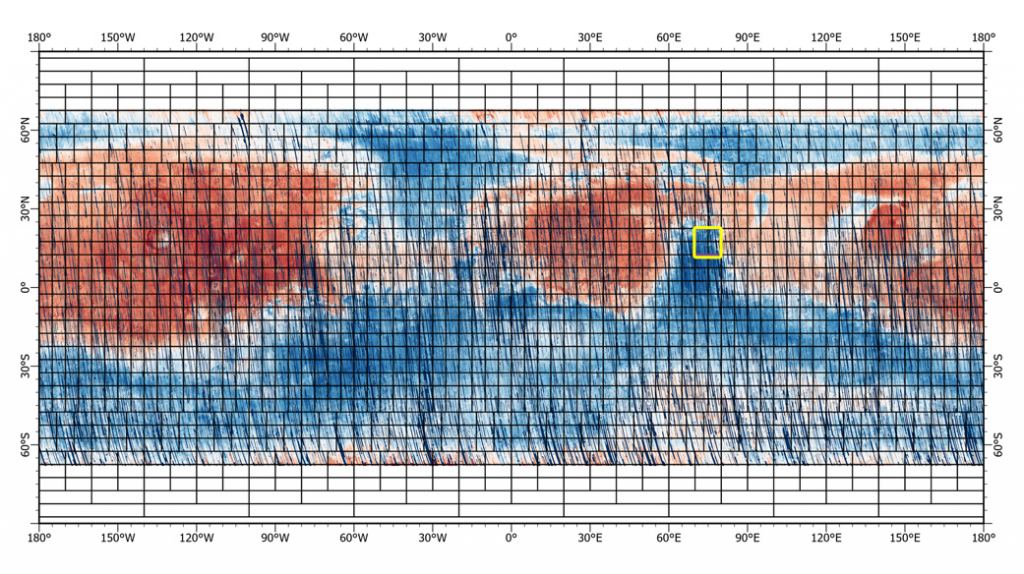
A near-global map of Mars, composed of nearly 51,000 mapping strips mosaicked into 1,764 tiles. The grid overlay shows the boundaries of the individual tiles. An additional 100 tiles in each polar region — not included here — are being processed separately. The map shows familiar large-scale surface brightness patterns, largely governed by the distribution of bright-red iron oxide-bearing dust. Darker, relatively dust-free regions consist of impact-fragmented crustal rock and wind-blown sand. The Nili Fossae region, where the Mars 2020 (Perseverance) rover is exploring Jezero Crater near the top-right quadrant, is indicated by the yellow box in the center-right part of the map. It’s also the location of the leading image. Credit: NASA/JPL-Caltech/Johns Hopkins APL
CRISM has made about 33,000 high-resolution images over the years, and they’ve helped identify landing sites for rover missions, and also inform the future Mars Sample Return mission. But while it was doing that work, it was also gathering lower-resolution mapping strips, about 83,000 of them. Now that CRISM is no longer active, the team is building their map from those strips.
This four-panel montage shows different aspects of the tile mosaic composed of data collected over the Nili Fossae region from the yellow rectangle in the larger image preceding it. Top left: An approximate natural colour rendering of Mars’ surface. Top right: Synthetic colour composite showing variation in iron mineralogy, with iron oxide appearing in red, iron-bearing minerals (e.g., olivine, high-calcium pyroxene) in blue, and low-calcium pyroxene in cyan. Bottom left: Water-altered iron- and magnesium-rich phyllosilicate clays, as well as some carbonates, with warm colours indicating a stronger feature. Bottom right: Synthetic colour composite showing the variation of unaltered igneous minerals, with olivine (red), low-calcium pyroxene (green), high-calcium pyroxene (blue), and mineral mixtures (other non-primary colours). Credit: NASA/JPL-Caltech/Johns Hopkins APL
Processing this much data into one cohesive map is a complicated task requiring powerful computing resources. It takes time to optimize the maps and account for environmental conditions and discrepancies between the different images. “For an individual tile, the optimization process might take just five hours in some exceptional cases, but sometimes it will take over a day,” said CRISM team member Katie Hancock, a software developer at APL who spearheaded the development of the optimization code. In a press release from JH/UAPL, Hancock said that it could take a computer cluster a month to build the map of the entire planet.
The map will be important for years to come and will fuel future discoveries about Mars. “It’s effectively a whole new data set that will fuel a second wave of discoveries about Mars’ surface composition,” said Scott Murchie, a planetary scientist at the Johns Hopkins Applied Physics Laboratory (APL) in Laurel, Maryland, and CRISM’s principal investigator. “In fact, one of the objectives of the next MRO extended mission is for its HiRISE camera to go back and image in colour the hundreds of new high-science priority spots we’re finding on the map — spots that haven’t been imaged at high resolution because their importance wasn’t known.”
CRISM is still operational in a limited way. Without a cryocooler, it can’t perform infrared observations and will be limited to visible light operations. It’s in standby mode right now and is on deck until it’s decommissioned in a few months.
The Mars Reconnaissance Orbiter is still going strong and has exceeded its planned mission length by several years. In 2018 NASA said it wants to keep the spacecraft operating through the late 2020s, at least. One of the obstacles to greater longevity is its aging gyroscopes, but NASA said they can rely on stellar navigation to maintain the spacecraft’s orientation. MRO’s HiRISE camera has captured almost 70,000 high-resolution images of the surface of Mars. It doesn’t rely on a cryocooler so as long as MRO is operating, we’ll still be seeing stunning visible light images of Mars.
The ESA’s Mars Express Orbiter is still operating at Mars, too, and it carries its own spectrometer. The Infrared Mineralogical Mapping Spectrometer, or Observatoire pour la Mineralogie, l’Eau, les Glaces et l’Activit (OMEGA) also uses near-infrared to map mineral concentrations on the Martian surface.
Frank Seelos, the lead on the CRISM mapping project, points out that the mission has been a success and the instrument doesn’t need to contribute any more than it has already to be a big part of Mars’ exploration.
“The warranty on this thing expired years ago before my kids were even born,” Seelos said. “The CRISM investigation has been very long-lived, and the fact that we were able to take data for so many years is amazing. The release of these tiles is a kind of exclamation point for the instrument’s legacy.”
CRISM has left its mark on multiple missions to Mars. This is an image of Mars’ Santa Maria Crater from Orbit. NASA’s Opportunity rover arrived at the western rim of Santa Maria Crater, some 90 meters wide, on Dec. 16, 2010, at a spot called “Palos”. Opportunity then drove in a counterclockwise direction to a spot called “Wanahani” at the southern edge. Researchers used data collected by CRISM to direct Opportunity’s route to Endeavour crater. Spectral observations recorded by CRISM indicated the presence of water-bearing sulphate minerals at the location shown by the red dot on the southeast rim crater. This image was taken by the High-Resolution Imaging Science Experiment (HiRISE) camera also on MRO. Credit: NASA/JPL-Caltech/Univ. of Arizona.
“The CRISM investigation has been one of the crown jewels of NASA’s MRO mission,” said Richard Zurek, the mission’s project scientist at NASA’s Jet Propulsion Laboratory in Southern California. “Analyses based on these final maps will provide new insights into the history of Mars for many years to come.”
If you’d like to take a deeper look at what CRISM shows us about the minerals on Mars’ surface, visit JHUAPL’s MICA site. MICA is a downloadable set of published descriptions and type locations of unique spectral features identified on Mars by using data from CRISM. It was published in 2019.
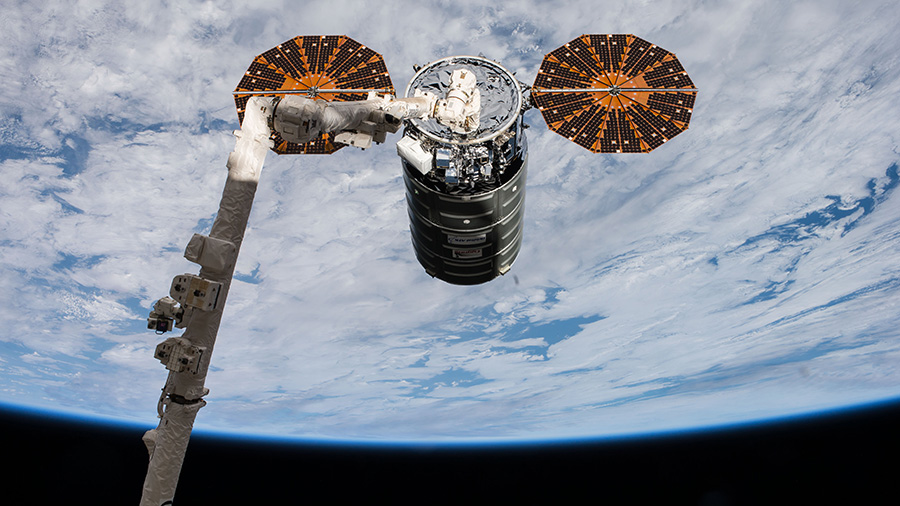
Northrup Grumman’s Cygnus cargo spacecraft conducted a successful reboost of the International Space Station over the past weekend, on Saturday, June 25, 2022. The Cygnus NG-17 “Piers Sellers” is the first US-based spacecraft to provide a substantial orbital adjustment to the ISS since the space shuttles retired in 2011. Russia’s Progress cargo spacecraft has been the primary source for station reboosts, attitude control, and debris avoidance maneuvers.
“This reboost of the ISS using Cygnus adds a critical capability to help maintain and support the space station,” said Steve Krein, vice president, civil and commercial space, tactical space systems, Northrop Grumman, in a press release. “It also demonstrates the enormous capability Cygnus offers the ISS and future space exploration efforts.”
Cygnus fired its gimbaled delta velocity engine for a total of 301 seconds, raising the station’s perigee by about 0.8 kilometers (1/2 mile) and its apogee by nearly 0.2 kilometers (.1 mile) for a test of “this enhanced capability for a standard service for NASA,” Northrup Grumman said. “This Cygnus mission is the first to feature this enhanced capability as a standard service for NASA.”
Cygnus had been docked to the ISS since February and now has departed, leaving on June 28. Back in 2018, the ninth Cygnus resupply mission conducted a test of the reboost capability by conducting a short 50 second burn of its main engine, raising the Station’s altitude by 90 meters (295 feet). The thruster firing on June 25 was actually the second attempt to raise the station’s orbit with the Cygnus NG-17, as on June 20, the maneuver was aborted after just five seconds. Northrup Grumman said the abort was triggered automatically and came as a “precautionary measure.” An investigation by engineers showed that the observed parameters were as expected and acceptable.
A previous Cygnus (OA-8) spacecraft is pictured after it had been grappled with the Canadarm2 robotic arm in 2017. Credit: NASA
Having US capabilities to provide propulsion to the ISS came to the fore as an issue following Russia’s invasion of Ukraine in late February 2022. After sanctions imposed on Russia by the US and other countries who are part of the space station consortium, thinly-veiled threats by Dmitry Rogozin, the Director-General of the Russian State Space Corporation (Roscosmos) indicated that Russia might be terminating its cooperation in space; he also suggested the country might use the ISS as a weapon. The Russian news agency RIA Novosti also showed a CGI video depicting the Russian modules detaching from the ISS. Other volleys on social media from Rogozin and others made for a tense few months, but tempers seemed to have cooled lately.
NASA says that normally, all International Space Station propulsion is provided by the Russian segments and Russian cargo spacecraft. A set of thrusters on the Zvezda module can be used, however, they are mainly reserved for when the Soyuz can’t conduct the task, as propellant on board the station is limited. The U.S. gyroscopes provide day-to-day attitude control or controlling the orientation of the station. “Russian thrusters are used for attitude control during dynamic events like spacecraft dockings and provide attitude control recovery when the gyroscopes reach their control limit,” NASA said.
Last night on ISS for Cygnus! Vehicle is fully loaded, hatch is closed, robotic arm has grappled it for unberthing early tomorrow morning. Thanks for bringing us supplies, for the orbit reboost and…. last but not least… for taking our trash! #MissionMinervapic.twitter.com/HIzt7e43Nh
— Samantha Cristoforetti (@AstroSamantha) June 28, 2022
Of course, since Cygnus has now departed, the space station remains reliant on the Russian sources for any needed maneuvers. While the head of SpaceX has intimated Dragon capsules could help maneuver the station, they currently do not hold that capability.
Northrup Grumman said providing reboosts and thruster capabilities is the latest in a series of improvements made to the spacecraft since its first mission to the station in 2013. The company has increased the amount of cargo it can carry to the station with a larger cargo module, added lighter and more powerful solar arrays and fuel tanks, and upgraded many of its systems to make reboost possible.
So far, Cygnus spacecraft have delivered more than 5,000 kg 112,000 pounds of equipment and supplies to the astronaut crews aboard the ISS. The Cygnus vehicle was packed with garbage before undocking, and it conducted controlled reentry over the Pacific Ocean on June 29.
A galactic nova flared briefly into naked eye visibility for a day, before vanishing from sight.
Some stars burn bright but brief. These transitory novae pepper the sky, with one flaring into naked eye visibility every few years… but it was a recent brief appearance of just such a ‘new star’ that gave astronomers a chance to probe the secrets of the Universe.
Japanese amateur astronomer Seidji Ueda was the first to raise the alarm worldwide. Amateurs are always on the hunt for galactic novae, as it’s one of the key fields where they can contribute to real science. The American Association of Variable Star Observers (AAVSO) has been the key clearinghouse for novae observations and light curves since 1911.
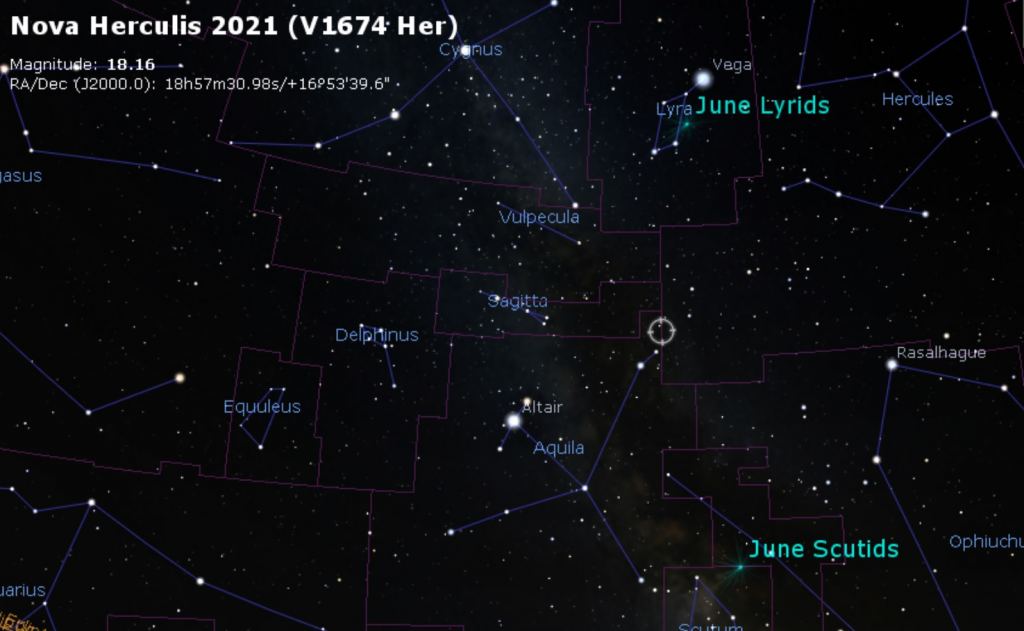
The discovery was made on the night of June 21st, 2021. The ‘star’ was a galactic nova in the northern constellation of Hercules the Hero, right along its border with Sagitta and Aquila, just off the galactic plane. Soon, the nova had a name: V1674 Herculis (V1674 Her or Nova Herculis 2021).
The location of Nova Herculis 2021 in the sky. Credit: Stellarium.
Generally, novae reach a peak brightness for several days or weeks before fading from view. Recent memorable novae include Nova Delphini 2013 and Nova Centauri 2013. Such ‘new stars’ can give familiar constellations a decidedly strange look.
This image from the New Technology Telescope at ESO’s La Silla Observatory shows Nova Centauri 2013 in July 2015 as the brightest star in the centre of the picture. This was more than eighteen months after the initial explosive outburst. This nova was the first in which evidence of lithium has been found. Credit: ESO
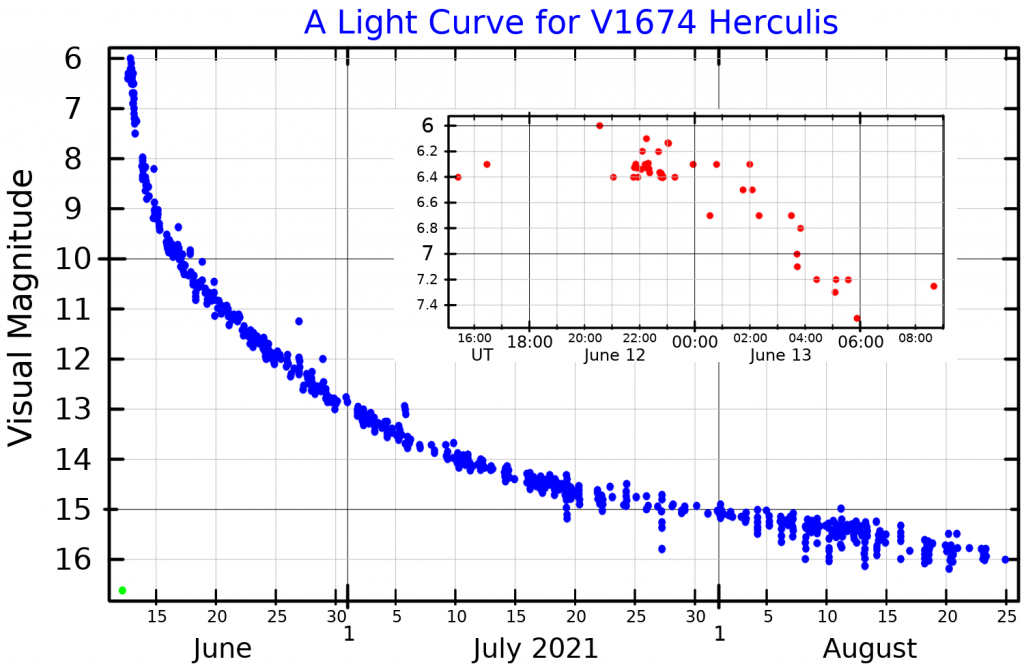
But Nova Herculis 2021 had a surprise in store. The nova topped out, flirting with naked eye brightness at magnitude +6 before fading from view in just one day. 24 hours after its eruption, the nova had faded a hundredfold. This tops the 3-day record set by Nova V838 Herculis (also in Hercules) in 1991.
The light curve for Nova Herculis 2021. Credit: AAVSO.
Novae are produced when a dense white dwarf star siphons material off a main sequence companion. The material becomes compressed on the surface of the white dwarf, which can then ignite under the pressure of nuclear fusion in a violent flash. Novae can erupt multiple times, in what’s known as a recurrent nova. Novae can also build up and evolve over time into supernovae, which can be seen across the Universe.
“The white dwarf that exploded is massive and growing in mass toward a Supernova 1A explosion,” astronomer Sumner Starrfield (University of Minnesota) told Universe Today. “It ejected far less mass than necessary to be accrete by the white dwarf and initiate an explosion.”
Nova are vital as they seed heavier elements back into the cosmos, and Type IA supernovae are used as standard candles to measure extra-galactic distances.
Stranger still, Nova Herculis 2021 exhibits a 501 second ‘wobble’. This oscillation is visible across the visible and x-ray spectrum, and is persistent from bright to faint magnitudes. This, along with variations in the energetic wind ejected by the nova into the surrounding interstellar medium seems to be driven by the orbital period of the white dwarf star versus its companion.
Nova Herculis 2021 is an estimated 4,750 parsecs (15,500 light-years) distant.
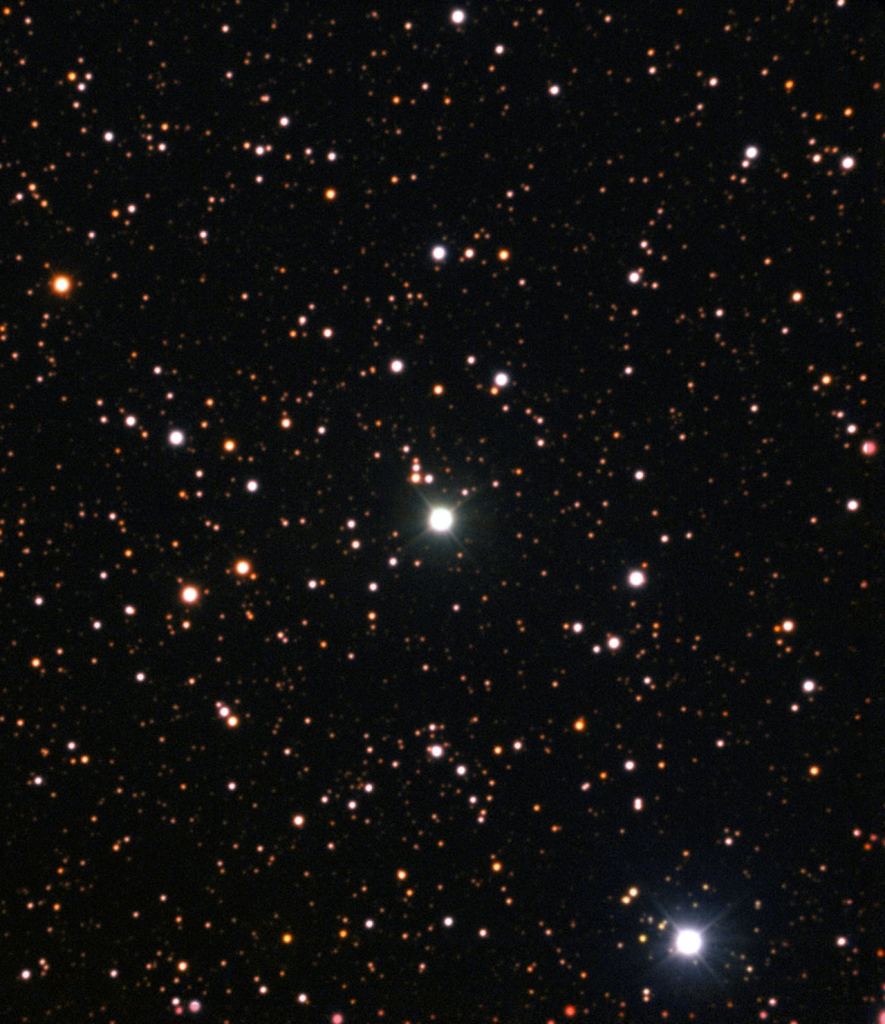
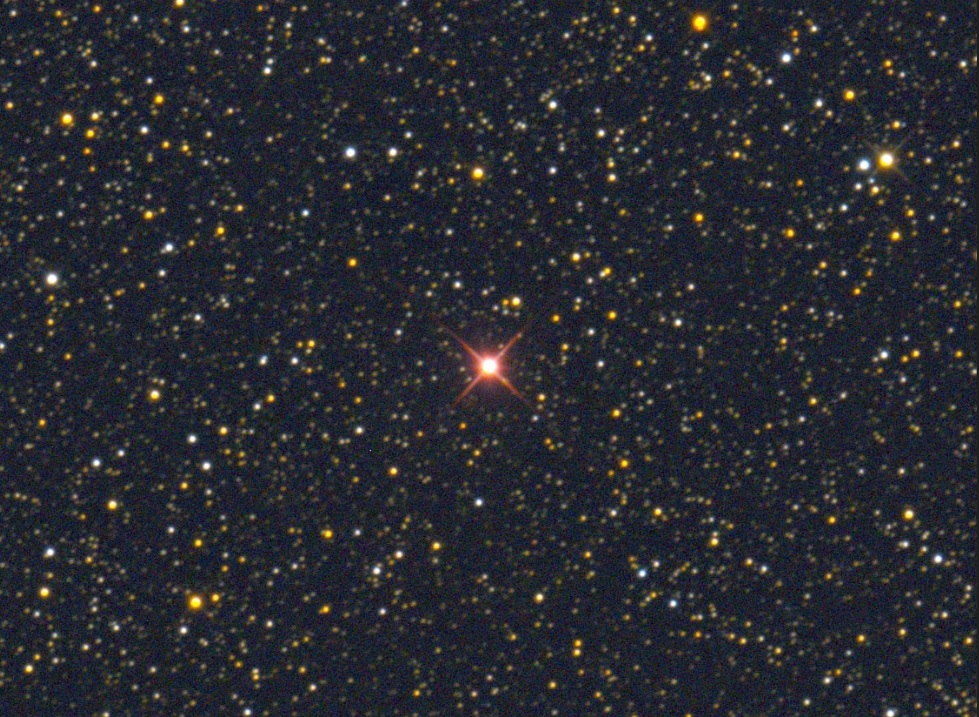
Nova Herculis 2021 flares briefly into prominence. Credit: Michael Jaeger.
“We are continuing to observe this system since it has not returned to quiescence,” says Starrfield. “We know that it has a ~500 second oscillation—presumably the white dwarf rotation period—and an about 3.6 hour rotation period that is probably the rotation period of the binary. We need more spectroscopy and photometry to better understand those periods and the implications of those periods.”
Observations of Nova Herculis 2021 were made using the Large Binocular Telescope on Mount Graham in Arizona, along with its multi-object double and PEPSI spectrograph.
Studying novae may also go a ways towards addressing the ‘cosmological lithium problem,’ and the source of lithium abundance in metal-rich stars like our Sun.
“Both theory and observations now imply that classical novae are the lithium producers in the galaxy,” says Starrfield. “A long standing problem has been why there is more lithium in stars like the Sun than produced by the Big Bang.”
Nova Herculis is a fascinating discovery to follow, in the strange stellar menagerie of our Universe.
Read the report on Nova Herculis out of University of Minnesota and Ohio State University in the Research Notes of the American Astronomical Society.
Astronomers using the ALMA Observatory have discovered an unusual, massive star near the center of our galaxy, a star that has two spiral arms. The arms are part of an accretion disk, a broad disk of dust and gas surrounding the protostar. While this is not the first star to be seen with such rare arm-like features, researchers say they believe they can track the formation of the spiral arms to a close encounter the star had with another object.
Accretions disks, also known as protostellar disks, usually form quickly around young stars, and over time the disks can stretch out to distances hundreds of times bigger than the nascent star. Astronomers say the disks are essential to star formation because they continuously feed gas from the surrounding environment to the growing stars.
Because of newer observatories with submillimeter observing capabilities like ALMA (Atacama Large Millimeter Array (ALMA) in the Atacama Desert in Chile, astronomers have been able to study distant protostars in the last few years. This has led to a wealth of observational and theoretical advances. However, much of the previous observations of these objects have been for lower mass, Sun-like stars.
A time-lapse image of the Atacama Large Millimeter/submillimeter Array (ALMA) at the Chajnantor Plateau in the Chilean Andes, showing a blazing meteor dishes that make up the array. Credit: ALMA.
The star observed in this study is near the galactic center and is an early O-type star that is extremely hot (over 30,000 Kelvin) and massive, at 32 solar masses. The disk is gigantic, with a diameter of about 4,000 astronomical units.
Since so few stars of this type have been observed so far, the researchers say it is still unclear whether accretion disks play a role in their formation, and if so, how. These massive stars are far more luminous than the Sun — several hundreds of thousands of times greater — which strongly impact the environment of the entire galaxy. Therefore, say the researchers, understanding the formation of massive stars is of great importance.
“This system is among the most massive protostars with accretion disks and represents the first direct imaging of a protostellar accretion disk in the Galactic Center,” said Qizhou Zhang in a press release. Zhang is a co-author of the study, from the Harvard Smithsonian Center for Astrophysics. “The discovery suggests that the formation of massive early O-type stars does go through a phase with accretion disks involved.”
The central region of the Milky Way, known as the galactic center, is about 26,000 light-years away from Earth and serves as a unique and important star-forming environment. The supermassive black hole Sagittarius A*, which sits at the very center of the Milky Way, is the most well-known object in the region.
In addition, there is a massive reservoir of dense molecular gas — mainly molecular hydrogen (H2) — which is the raw material for star formation. The gas will start to form stars once gravitational collapse is initiated. However, direct observations of star-forming regions around the galactic center are challenging, given the considerable distance and the contamination from foreground gas between the galactic center and Earth. A very high resolution, combined with high sensitivity, is necessary to resolve details of star formation in this region.
Most interesting, however, is that the accretion disk clearly displays two spiral arms. Astronomers have seen spiral arms before, as they are commonly found in spiral and pinwheel galaxies where hundreds of millions of stars spiral together around a common core. However, finding a clear case of spiral arms around an individual star, is very unusual.
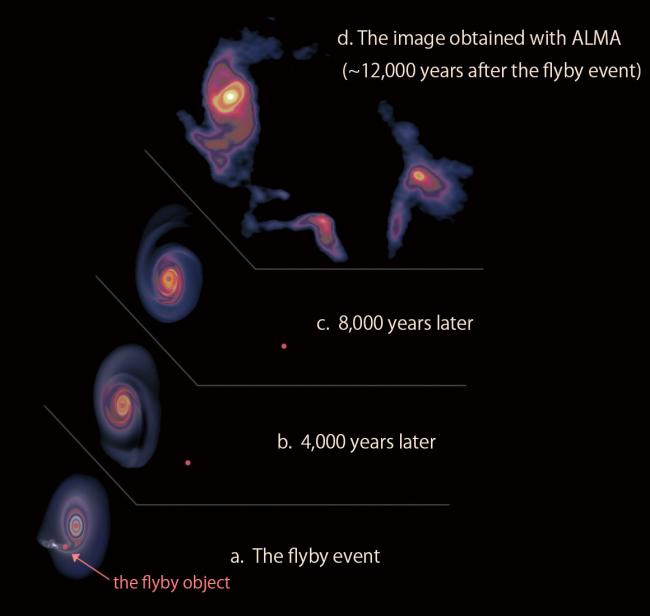
A close encounter more than 10,000 years ago stirred up a protostellar disk around a star at the galactic center. Image credit: Lu et al.
“The disk is gravitationally stable with two embedded spirals,” the team wrote in their paper, published in Nature Astronomy. “A combined analysis of analytical solutions and numerical simulations demonstrates that the most likely scenario to form the spirals is through external perturbations induced by a close flyby, and one such perturber with the expected parameters is identified.”
The researchers detected an object of about three solar masses at about 8,000 astronomical units away from the disk. Through analytics and numerical simulations, they reproduce a scenario where an object flew by the disk more than 10,000 years ago and perturbed the disk, leading to the formation of spiral arms.
“The numerical simulation matches perfectly with the ALMA observations. We conclude that the spiral arms in the disk are relics of the flyby of the intruding object,” says Xing Lu, the lead author and an associate researcher at the Shanghai Astronomical Observatory of the Chinese Academy of Sciences.
The astronomers say that this finding demonstrates that accretion disks at the early evolutionary stages of star formation are subject to frequent dynamic processes such as flybys, which would substantially influence the formation of stars and planets.
The team noted that similar flybys have also happened in our Solar System: A binary stellar system known as Scholz’s Star flew by the solar system about 70,000 years ago, probably penetrating through the Oort cloud and sending comets to the inner solar system. The researchers said that in a high steller density environment such as the galactic center, similar flybys would likely be frequent.
“The formation of stars should be a dynamical process, with many mysteries still unresolved,” says Lu. “With more upcoming high-resolution ALMA observations, we expect to disentangle these mysteries in star formation.”