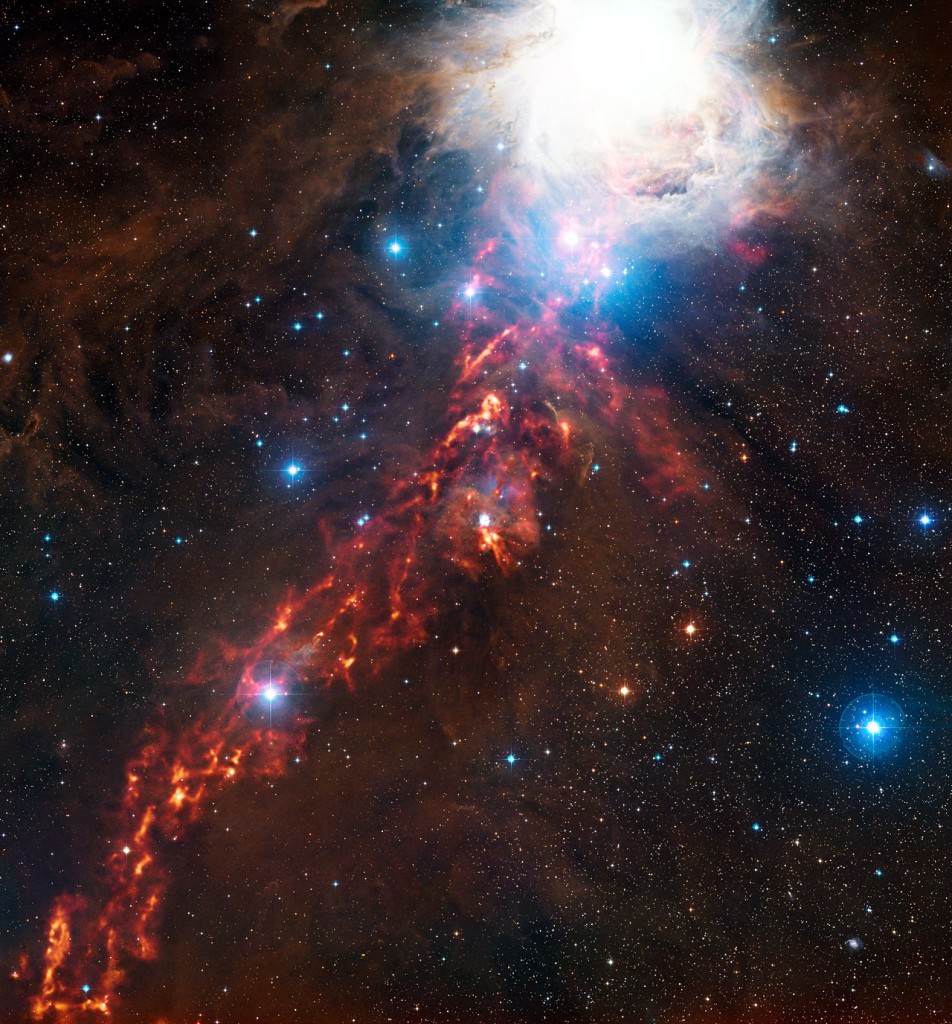
Ever wonder what it would be like to fly through the Orion Nebula with all its newborn stars? Or buzz through the California Nebula? Of course, we’ve seen simulated “fly-throughs” of nebulae in sci-fi TV and movies and on planetarium domes. But, what if we had a warp-speed spaceship and could chart a path through the real thing? The first thing we’d need is accurate data about that region of space. That’s where a 3D model with precise distance measurements to stars and other objects would come in really handy.
Today, we’re not traveling on spaceships to the stars, but we do have a navigator showing us the way. It’s called the Gaia spacecraft, and it uses a pair of telescopes to do space-based astrometry. The goal is to measure distances to over a billion stars in our galaxy from Earth’s LaGrange 2 point. Having accurate distances to objects throughout the galaxy gives a complete 3D view of the Milky Way.
Gaia Helps Measure Nebulae
However, Gaia’s work is helpful in more than astrometry. Its data enabled a team of scientists to create realistic 3D views of the Orion A and California nebulae. Those models will help them understand why one is a starforming behemoth and the other is quiet.

Revealing 3D Nebulae
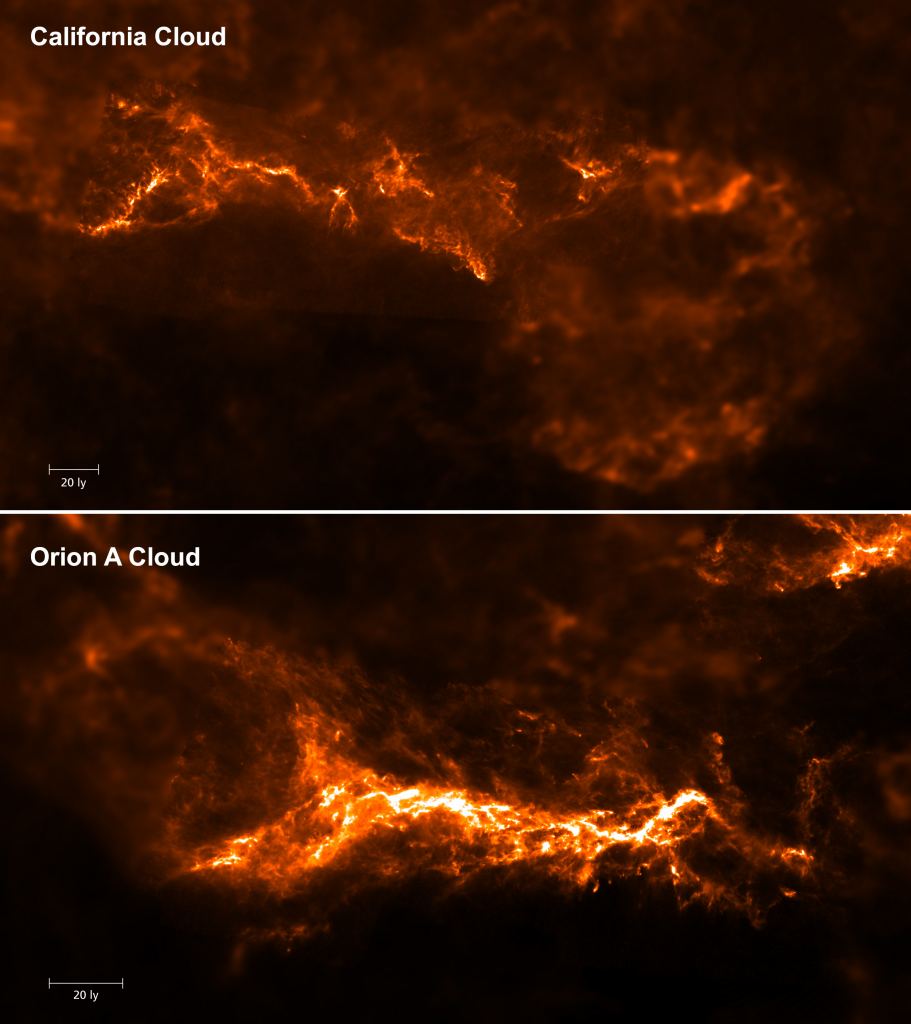
The new 3D reconstructions shown in the video below are by Sara Rezaei Khoshbakht (Max Planck Institute in Heidelberg) and Jouni Kainulainen (Chalmers University, Gothenberg). Their work shows the Orion A (in the Orion Molecular Cloud complex) and California nebulae in a new way. From Earth, these clouds appear somewhat similar, with a few differences in their structures. However, astronomers didn’t have a good feel for their three-dimensional sizes and shapes.
Orion A in 3D presents a much different view, as seen in this video (above). It has a very dense filamentary structure and is quite complex. It is much denser than the California Nebula and has thick condensations along a prominent ridge of gas and dust. As we all know, it’s also a busy star-forming region.
The California Nebula is nearly edge-on from our point of view. It’s about 500 light-years across, so astronomers don’t have just one main distance measurement for it. In 3D (below), however, it looks fairly flat and shows a small amount of filamentary structure and dense regions. It also has a large bubble extending beneath the main cloud. The Gaia data show that it’s not nearly as dense as astronomers thought. That probably explains why it’s not as busy a starbirth region as the Orion A cloud.
Reconstructing Nebulae
To make their 3D reconstructions, the two scientists used a method Rezai Khoshbakht first developed for her Ph.D. research. They input data Gaia generated when it studied starlight as it passed through a nebula’s gas and dust. “We analyzed and cross-correlated the light from 160,000 and 60,000 stars for the California and Orion A Clouds, respectively,” she said in a recent press release.
From that data, they reconstructed the shapes of the clouds and their densities at a resolution of only 15 light-years. It’s a valuable addition to the nebula-measuring toolbox. For one thing, it gives a much better idea of why some nebulae are star-forming monsters and others are not. Beyond this current study, Rezaei Khoshbakht plans to use the same method to study the entire Milky Way. She will map out its dust distribution and figure out how that connects to star formation throughout the galaxy.
Nebula Density 101
Nebulae are clouds of gas and dust that appear throughout our galaxy and are seen in many other galaxies, too. Not all of them make stars. However, the ones that do have just the right amount of “star-maker material” to do the job. In a typical star-forming region such as the Orion Nebula, star formation begins with cold, dense pockets of material. The low temperatures make the dense regions collapse even more. Then, the thick regions start to heat up under increased pressure until conditions are just right to form a star. If a nebula has a lot of material, it’s pretty efficient as a star-maker. If it’s not very dense, that efficiency is low.
When astronomers want to figure out the star formation efficiency of a nebula, traditionally they had to approximate its density. That’s how much gas and dust exists in the cloud. But, “approximate” is not the same as “accurate”
“Density is the amount of matter compressed into a given volume; it’s one of the crucial properties that determine star-formation efficiency,” said Rezaei Khoshbakht. She also pointed out that some clouds of gas and dust are more efficient star producers than others. Density has a lot to do with that.
Kainulainen works on calculating the densities of objects in space, which is not an easy task. “Everything we see when we observe objects in space is their two-dimensional projection on an imaginary celestial sphere,” he said. Conventional observations lack the necessary depth that astronomers need to get accurate measure measurements in space. Until now they’ve had to rely on the column density. The new 3D reconstructions the pair created provide an advanced astrometric tool for understanding star birth in nebulae throughout the galaxy.
Gaia’s Astrometrical Role
Using Gaia data (and data from other observations) will give astronomers a more complete 3D view of the Milky Way. This includes where stars are distributed throughout the spiral arms and core. In addition, the galaxy is currently “ingesting” the Sagittarius Dwarf Galaxy. Gaia should be able to map its stars as they mix into the Milky Way. And, of course, Gaia’s study of starlight as it passes through nebulae is important. It provides clues to the engines of starbirth that hatch newborn stars in stellar nurseries.
It’s not a stretch to think Gaia’s data will be part of stellar databases for a long time to come. Maybe someday, it will even help guide humans on that long-awaited trip through a nebula.
For More Information
3D Shape Explains Star Formation Mystery of California and Orion A
The post Thanks to Gaia, Astronomers are Able to Map Out Nebulae in 3D appeared first on Universe Today.
No comments:
Post a Comment